Multi-Period Report
The Multi-Period Report in Pro Stock Tracker provides an in-depth analysis of your portfolio's performance over various time frames. By comparing up to four different periods, you gain valuable insights into trends and the effectiveness of your investment strategies.
This report allows you to group your holdings by market, country, currency, sector, industry, or asset class, with each group's performance summarized alongside the overall portfolio. You can review metrics such as total return, capital gain, dividends gain, and currency gain, presented in both monetary and percentage terms. Additionally, the report includes percentage returns shown as both annualized and cumulative figures. By comparing performance over different periods, you can contextualize your results, identify patterns, and refine your investment approach with confidence.
Understanding the report
Options: Customize your report and export data using the available options:
- Periods: Select from pre-set periods (e.g., last 4 months, last 4 years) or create custom periods to compare (up to a maximum of four).
- Grouped by: Organize your holdings by market, country, currency, sector, industry, asset class, or "Ungrouped" for a single list.
- Return type: Choose to display total return or focus on specific components like capital gain, dividend gain, or currency gain.
- Show: View percentage gains as either annualized (compounded annual percentage) or cumulative (total percentage over the period). Note that this selection does not affect monetary gain figures.
- Display: Toggle between viewing monetary gains or percentage gains for your returns.
- Export: Download the report data as a CSV file.

Chart: The interactive chart visualizes your chosen return type (total return or specific component) across the selected periods. It displays both monetary and percentage values, with percentage returns shown as either annualized or cumulative based on your selection.
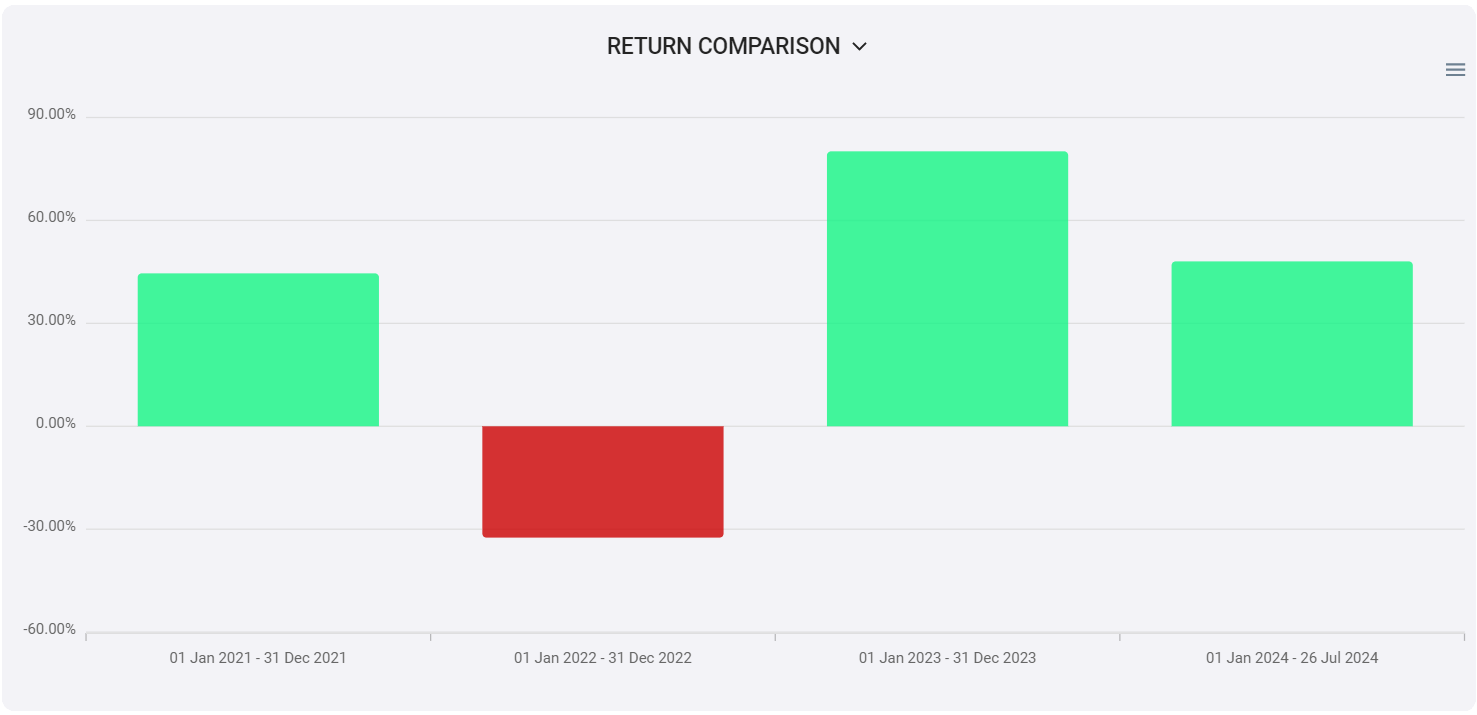
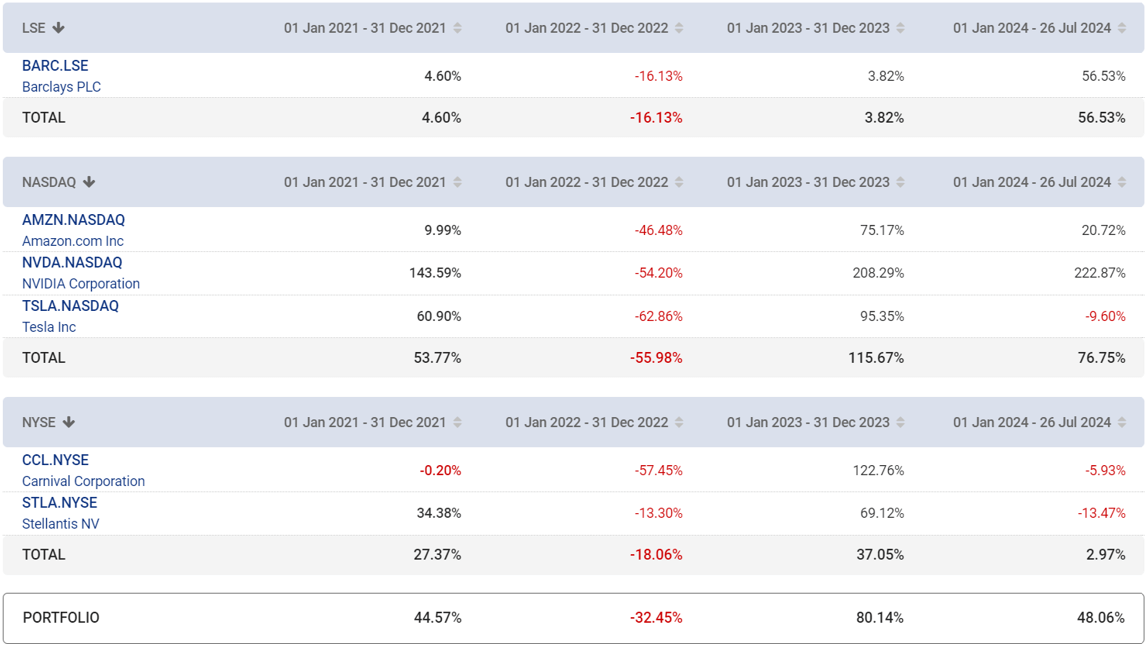
Table: The detailed table displays:
- Individual groups and holdings: Present in each selected period.
- Returns: For each holding, group, and the overall portfolio, shown in both monetary and percentage terms for each period, reflecting the return type selected (total return or its components). Percentage returns are displayed as annualized or cumulative based on your filter choice.
You can sort the table by clicking on any column header. You can also click on any holding name to view its individual page and see the holding's complete transaction history.
How to use the report
To use the report:
- Go to Multi-Period Report.
- Use the filters to customize your report by selecting the desired periods, grouping, return type, whether to view returns as monetary amounts or percentages, and if viewing percentages, whether to display them as annualized or cumulative values.
- Analyze the chart to visualize your portfolio's performance across the chosen periods.
- Examine the table for a detailed breakdown of returns for each holding, group, and the overall portfolio in every selected period.
- (Optional) Click the Export button to download the report data as a CSV file.
Note: Return figures are always relative to the specific periods you select.