Analyze Your Portfolio Across Time with Pro Stock Tracker's Multi-Period Report
Analyze your investment performance over various periods, uncover trends, and optimize your strategy with Pro Stock Tracker's Multi-Period Report.
Pro Stock Tracker
In the ever-evolving landscape of investments, understanding how your portfolio performs across different time frames is crucial. Pro Stock Tracker's Multi-Period Report is a powerful tool designed to provide an in-depth analysis of your portfolio's performance over multiple periods. By comparing up to four different periods, investors gain valuable insights into trends and the effectiveness of their investment strategies, enabling them to make more informed decisions.
Key features of the Multi-Period Report
Customization options
The Multi-Period Report allows you to compare your portfolio's performance across various periods, offering a detailed view of how different investments perform over time. Investors can select from preset periods (e.g., last 4 months, last 4 years) or create custom periods to compare, up to a maximum of four. You can group your holdings by market, country, currency, sector, industry, or asset class, with each group's performance summarized alongside the overall portfolio. This grouping capability helps investors see which segments are driving performance and which might need reevaluation.
Detailed metrics
Understanding the specific metrics that influence your portfolio is essential. The Multi-Period Report provides a breakdown of total return, capital gain, dividends gain, and currency gain. These metrics are presented in both monetary and percentage terms, giving a clear picture of how each component contributes to the overall performance. Additionally, the report includes percentage returns shown as both annualized and cumulative figures, allowing you to contextualize your results and better understand long-term trends.
Interactive chart
The Multi-Period Report features an interactive chart that offers a dynamic visual representation of your portfolio's performance. This chart allows you to toggle between different views, making it easy to highlight specific components such as total return, capital gain, dividend gain, or currency gain. By interacting with the chart, you can drill down into specific periods and metrics, enabling a more nuanced analysis of your portfolio's performance over time.
Detailed table
The detailed table in the Multi-Period Report enhances data clarity and accessibility. This table organizes your portfolio's holdings and groups them by your chosen criteria (e.g., market, sector). It allows for easy sorting and filtering, enabling you to quickly pinpoint specific data points or trends. Additionally, each holding's name is clickable, providing direct access to more detailed information about its performance and transaction history.
Export functionality
The Multi-Period Report includes an export feature that allows you to download the report data as a CSV file. This functionality is beneficial for further analysis in spreadsheet software or for sharing insights with financial advisors and other stakeholders. The ability to export data ensures you can keep comprehensive records of your portfolio's performance over time.
Benefits of using the Multi-Period Report
Identifying trends and patterns
One of the main advantages of the Multi-Period Report is its ability to help investors identify trends and patterns in their investment strategies. By comparing performance across different periods, you can spot consistent performers and identify underperforming assets. For instance, if a particular sector consistently outperforms others, you might consider increasing your allocation in that area. Conversely, if an asset class shows declining returns over multiple periods, it might be time to reassess its place in your portfolio.
Refining investment strategies
The insights gained from the Multi-Period Report can be instrumental in refining your investment strategies. By understanding how your portfolio performs over various time frames, you can make more informed decisions about asset allocation, rebalancing, and risk management. For example, if the report shows that your portfolio performed well during periods of market volatility, you might decide to maintain or increase your exposure to certain asset classes that thrive in such conditions.
Practical applications of the Multi-Period Report
The Multi-Period Report is a versatile tool with numerous use cases for investors.
Contextualize performance
By comparing your portfolio's current performance to previous periods, the Multi-Period Report helps you gain a deeper understanding of its progress and identify areas for improvement. You can assess whether your returns are consistent over time or if there are specific periods where your portfolio has outperformed or underperformed. This contextual analysis is crucial for fine-tuning your investment strategies and ensuring sustained growth.
Uncover trends
The Multi-Period Report allows you to identify patterns and fluctuations in your portfolio's performance over specific time frames. It helps you determine whether your portfolio has been consistently growing or experiencing periods of volatility. By analyzing these trends, you can anticipate future market movements and make more informed investment decisions, enhancing your ability to respond to changing market conditions.
Assess strategy effectiveness
Evaluating the impact of your investment decisions and strategies over various time frames is made easy with the Multi-Period Report. You can determine if a particular strategy led to significant gains during a specific period or if a market correction negatively impacted certain holdings. This report helps you pinpoint the factors that contribute to your portfolio's success or struggles, enabling you to adjust your strategies accordingly.
Identify winning and losing Investments
Pinpointing high-performing assets and those that may need reevaluation is a key benefit of the Multi-Period Report. By analyzing historical data, you can identify which holdings consistently deliver strong returns and which are lagging behind. This insight allows you to make informed decisions about buying, selling, or holding specific investments, ensuring your portfolio remains optimized for growth and performance.
Assessing portfolio rebalance impact
The Multi-Period Report is particularly useful for assessing the impact of portfolio rebalances. By comparing performance before and after rebalancing, investors can evaluate the effectiveness of their adjustments. This comparison can highlight the benefits of rebalancing and help you understand how changes in asset allocation affect overall performance. Additionally, you can compare performance against market corrections or other significant events to see how well your portfolio withstands market fluctuations.
Evaluating dividend performance
For dividend investors, the Multi-Period Report is an invaluable tool. It allows you to track the long-term performance of dividend-paying stocks, helping you identify which stocks are consistently delivering returns. By comparing dividend payouts over multiple periods, you can spot underperforming stocks and make necessary adjustments to maximize your income. This long-term view is crucial for maintaining a robust dividend portfolio and achieving your financial goals.
Benchmarking against the market
Benchmarking your portfolio's performance against market indices, ETFs or fund manager periods is another practical application of the Multi-Period Report. By comparing your portfolio's returns with those of benchmarks, such as ETFs or mutual funds, you can gain insights into how well your investments are performing relative to the market. This comparison can help you identify areas for improvement and validate your investment strategy over different market cycles.
Overlapping vs distinct periods
When using the Multi-Period Report, you can choose to analyze either overlapping or distinct periods. Overlapping periods show the combined performance of your portfolio over cumulative time frames, while distinct periods focus on specific, non-cumulative intervals.
Overlapping periods
Analyzing overlapping periods is ideal for assessing long-term growth and understanding the compounding effects of your investments. This approach can help you identify trends over extended periods and evaluate the overall effectiveness of your investment strategy.
Distinct periods
Analyzing distinct periods is useful for pinpointing specific time frames where your portfolio may have excelled or underperformed. This approach can help you isolate the factors that contributed to these results and make more targeted adjustments to your investment strategies.
The choice between overlapping and distinct periods depends on your specific goals and interests. If you're primarily interested in long-term growth and overall performance, overlapping periods may be more appropriate. However, if you want to analyze specific events or time frames in detail, distinct periods can provide more targeted insights.
Case studies and examples
Real-world examples can illustrate how different investors can use the Multi-Period Report to make informed decisions. For instance, a growth investor might use the report to compare performance during periods of market expansion versus contraction, helping them identify which growth stocks are most resilient. Meanwhile, an income investor could analyze the consistency of dividend payouts across various economic cycles, ensuring their portfolio generates reliable income.
Analyzing a sample portfolio
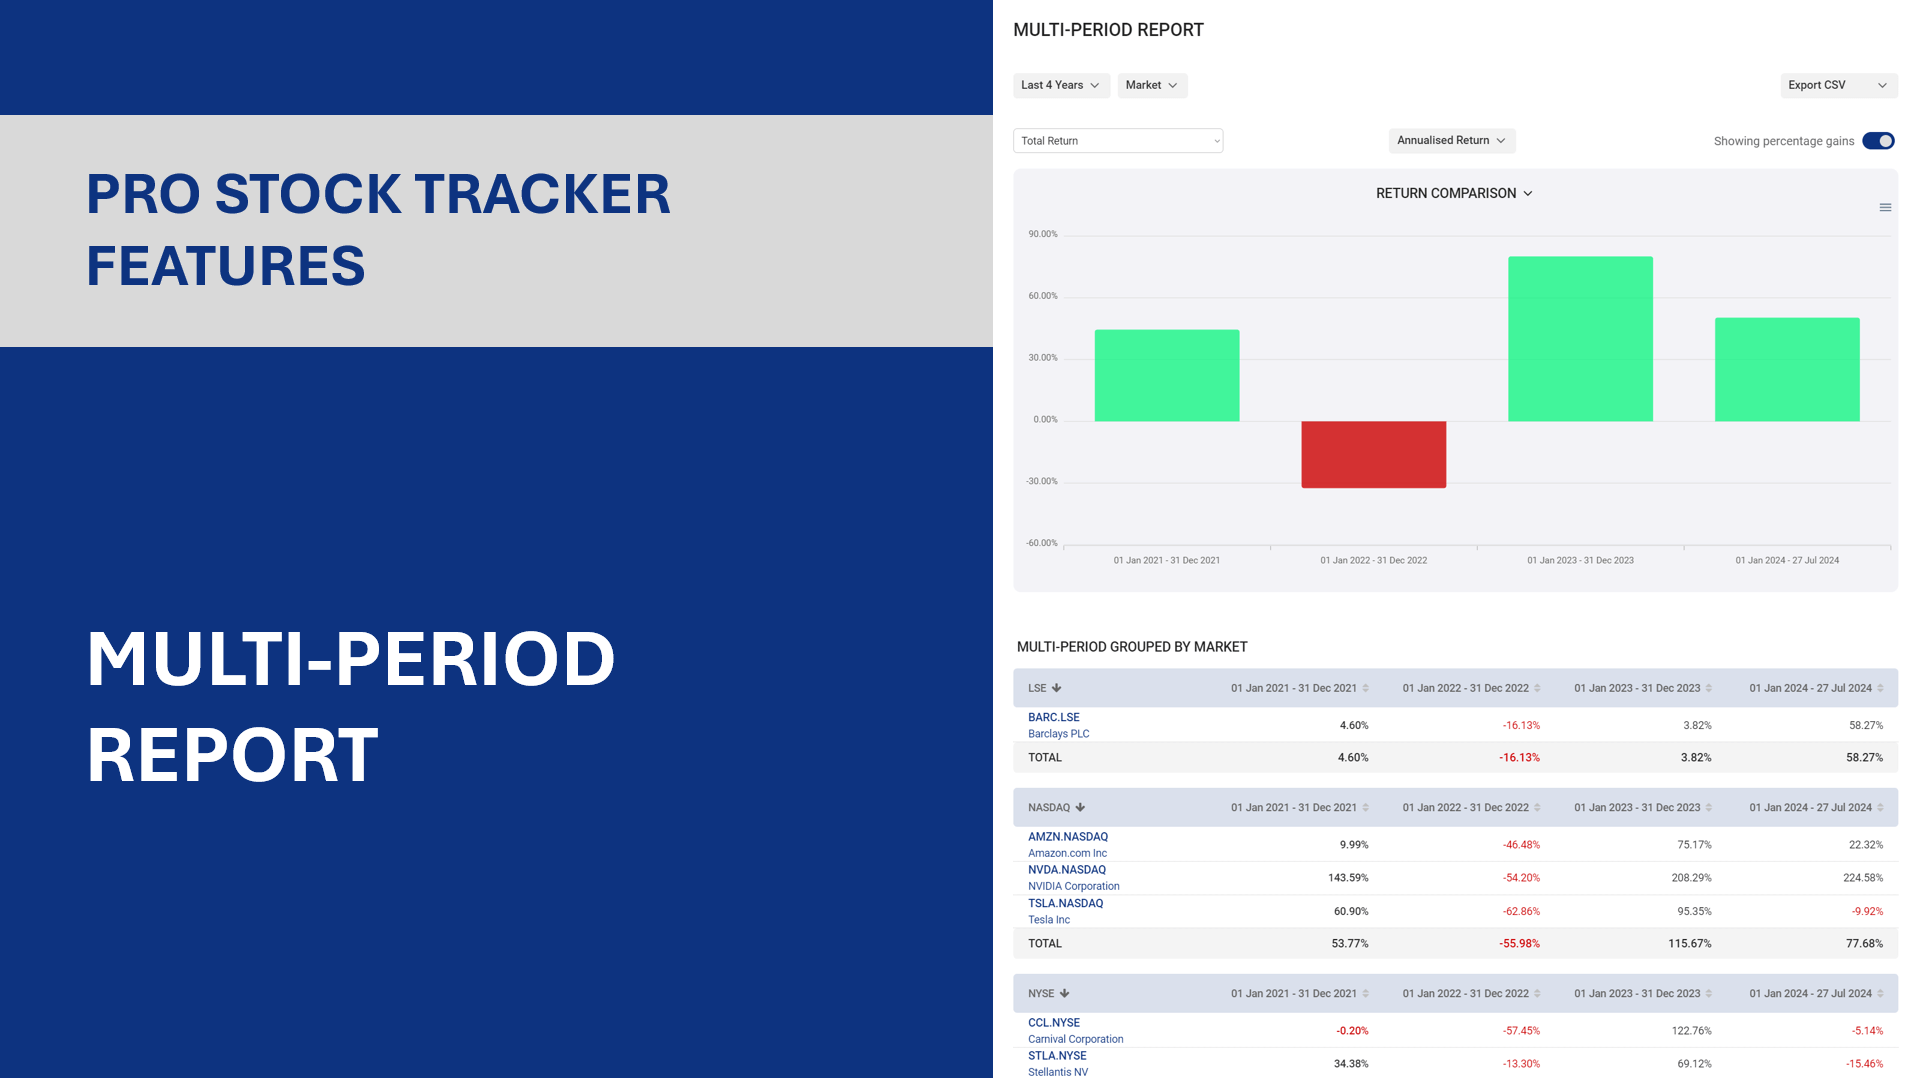
Let's say you're an investor who wants to evaluate the performance of their diversified portfolio over the past few years. You decide to use Pro Stock Tracker's Multi-Period Report to compare your portfolio's performance across the last four calendar years.
By selecting the "last 4 years" option, you can quickly generate a report that shows your portfolio's annualized and cumulative returns for each year. The interactive chart visually displays your portfolio's performance over time, while the detailed table provides a breakdown of returns for each holding and group.
By analyzing this data, you can identify any trends or patterns in your portfolio's performance. For example, you might notice that your technology stocks have consistently outperformed your other holdings, or that your portfolio experienced a significant downturn during a particular market correction. These insights can then inform your future investment decisions, such as reallocating assets, adjusting your risk profile, or exploring new investment opportunities.
How to use the Multi-Period Report
Using the Multi-Period Report in Pro Stock Tracker is straightforward. Follow these steps to get the most out of this powerful tool:
- Go to Multi-Period Report: Navigate to the Multi-Period Report section in Pro Stock Tracker.
- Select periods: Use the filters to customize your report by selecting the desired periods. You can choose from pre-set options or create custom periods up to a maximum of four.
- Group holdings: Organize your holdings by market, country, currency, sector, industry, asset class, or "Ungrouped" for a single list.
- Choose return type: Select whether to display total return or focus on specific components like capital gain, dividend gain, or currency gain.
- View returns: Decide whether to view returns as monetary amounts or percentages. If viewing percentages, choose to display them as annualized or cumulative values.
- Analyze the chart: The interactive chart visualizes your chosen return type across the selected periods, displaying both monetary and percentage values.
- Examine the table: The detailed table shows returns for each holding, group, and the overall portfolio in every selected period. You can sort the table by clicking on any column header.
- Export data: If needed, click the Export button to download the report data as a CSV file for further analysis or sharing.
Conclusion
The Multi-Period Report in Pro Stock Tracker is an essential tool that offers deep insights into your portfolio's performance across multiple time frames. By leveraging its comprehensive features and customizable options, you can identify trends, refine your investment strategies, and make informed decisions to optimize your portfolio. Whether you are assessing the impact of a portfolio rebalance, evaluating dividend performance, or benchmarking against market indices, the Multi-Period Report provides the information you need to achieve your financial objectives.
Want more information?
Visit our Learn page for more detailed instructions, or start your free trial now to experience the benefits first-hand.
Unlock your investment potential with Pro Stock Tracker
Ready to unlock deeper insights into your investments? Explore the Multi-Period Report feature in Pro Stock Tracker today. With its robust analytical capabilities and user-friendly interface, you'll be empowered to make more informed investment decisions. Sign up today and unlock the power of:
- Comprehensive tracking: Seamlessly monitor your stocks, ETFs, forex, cryptocurrencies, bonds, and mutual funds across 86 global exchanges – all in one place.
- 30+ years of historical data: Gain unparalleled insights backed by our robust historical data infrastructure.
- Automated accuracy: Ensure your financial information is always up-to-date with automatic dividend and corporate action synchronization.
- Powerful analytics: Access a suite of advanced tools, from in-depth performance reports to portfolio diversification and comparison analyses.
Don't miss out on the opportunity to make informed, data-driven decisions that can transform your investment journey. Sign up for a free account today and experience the difference Pro Stock Tracker can make for your portfolio.
Disclaimer: The information provided in this article is for general informational purposes only and does not constitute specific advice, including but not limited to financial, investment, or legal advice. While we strive to ensure the accuracy and completeness of the information, we make no guarantees and assume no liability for any actions taken based on the content provided. Please consult with a qualified professional for advice tailored to your individual circumstances.