Contribution Report
The Contribution Report in Pro Stock Tracker provides a detailed analysis of how each holding or group within your portfolio contributes to its overall performance, breaking down the impact of capital gains, dividends, and currency fluctuations. This granular view allows you to identify the key drivers of your returns, pinpoint areas for potential improvement, and make informed decisions about your investment strategy. Whether you're interested in understanding the performance of individual stocks or evaluating the effectiveness of broader asset allocation strategies, the Contribution Report offers valuable insights to help you optimize your portfolio.
Understanding the report
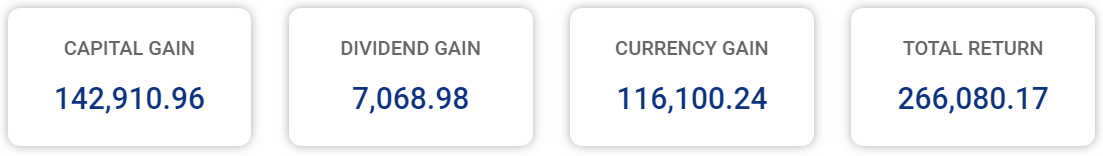
Tabs: Four tabs at the top summarize the key monetary return components of your portfolio, providing insights into either total or active investments based on your selected filter:
- Capital gain: Your portfolio's capital gains or losses over the selected period.
- Dividend gain: Your portfolio's dividend gains over the selected period.
- Currency gain: Your portfolio's currency gains or losses over the selected period.
- Total return: Your portfolio's total return over the selected period.
Options: Customize your report and export data using the available options:
- Period: Choose from preset periods (e.g., last 3 months, last 5 years) or define a custom date range.
- Positions: Select "Total Investments" to see the performance of all shares held in the portfolio during the selected period (including sold shares), or "Active Investments" to see the performance of only those shares held at the end date (excluding sold shares).
- Grouped by: Organize your holdings by market, country, currency, sector, industry, asset class, or "Ungrouped" for a single list.
- Export: Download the report data as a CSV file.
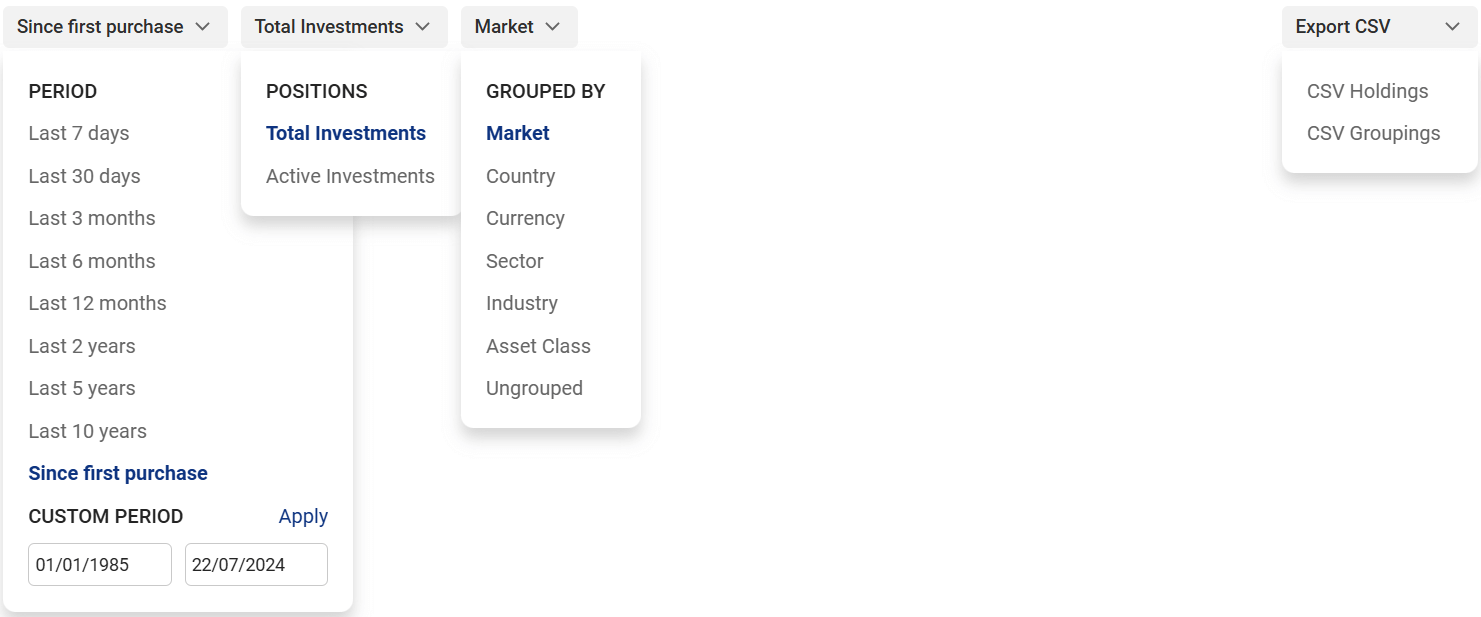
Chart: The interactive chart visualizes the contributions of the selected group (or the full list of holdings if "Ungrouped" is chosen) over the selected period. Toggle between:
- Showing monetary contributions in your portfolio's base currency.
- Showing percentage contributions.
The chart's visualization reflects your "Positions" filter selection, illustrating contributions based on either total investments (including sold shares) or active investments (excluding sold shares).
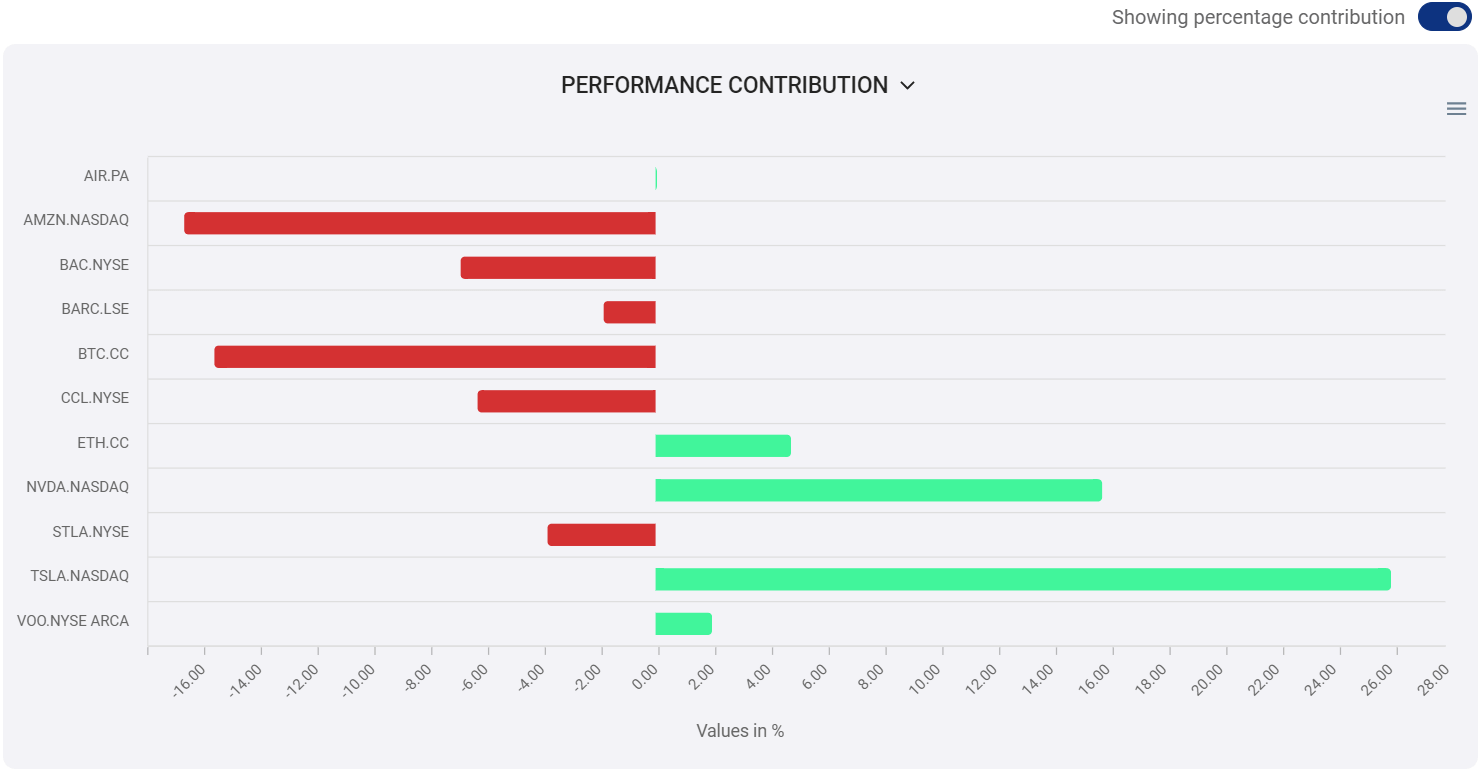
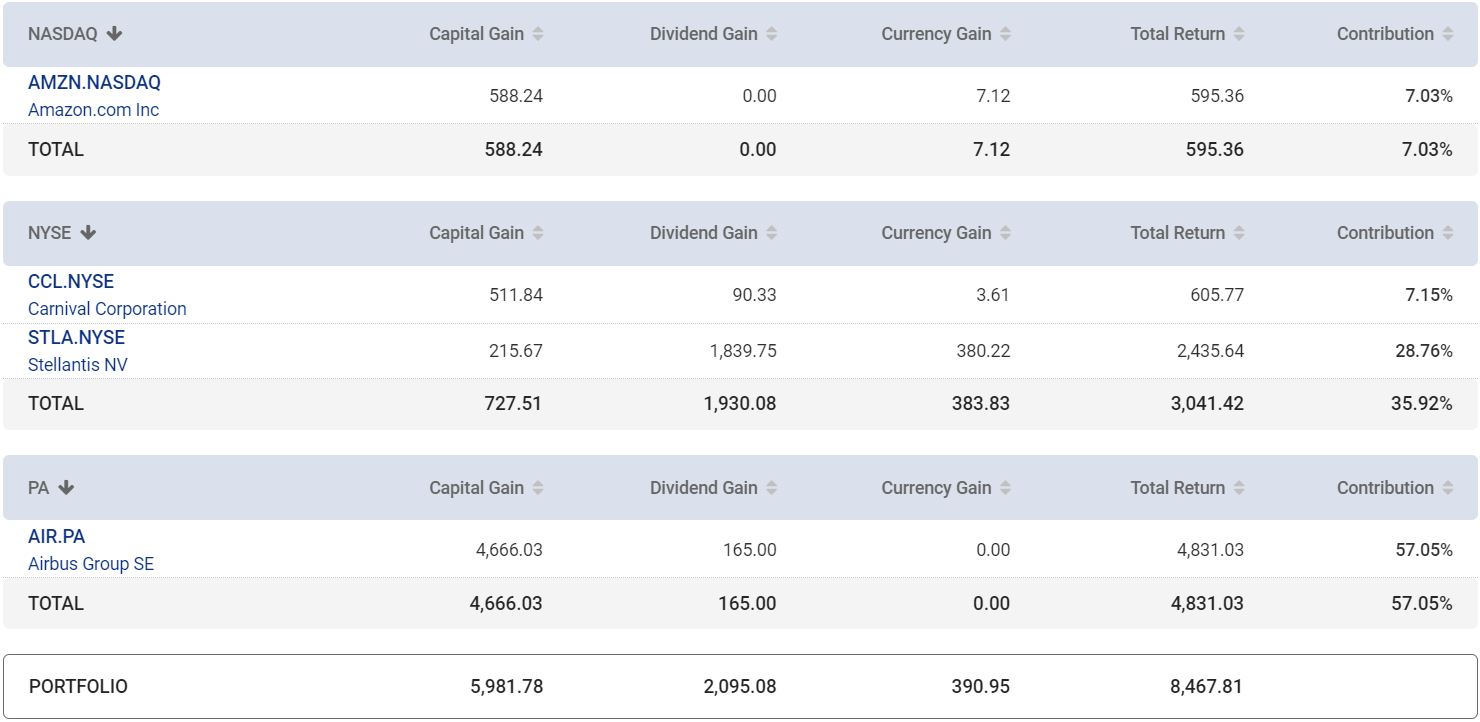
Table: The detailed table displays:
- Individual groups and holdings present in the selected period, determined by your choice of "Total Investments" or "Active Investments".
- Capital gains, dividend gains, currency gains, and total return for each group and holding, calculated over the selected period.
- The percentage contribution of each group and holding to the overall portfolio performance over the selected period.
Table values are displayed in your portfolio's base currency and, like the chart, reflect your "Positions" filter selection, showing either the performance of all shares held during the selected period (including sold shares) or the performance of shares held at the end date (excluding sold shares).
You can sort the table by clicking on any column header. You can also click on any holding name to view its individual page and see the holding's complete transaction history.
How to use the report
The steps below will give you a quick overview on how to use the report.
- Go to Contribution Report.
- Customize the report using the filters to select your desired period, positions, and grouping.
- Review the tabs at the top for a summary of your portfolio's monetary return and its components.
- View the chart to visualize contributions, either for the selected group or for the full list of holdings if "Ungrouped" is chosen.
- Analyze the table to see the return and contribution details for each holding and group.
- (Optional) Click the Export button to download the report data as a CSV file.
Note: The return and contribution figures are always relative to the period you select.