Optimize Portfolio Performance with Pro Stock Tracker's Contribution Report
Pro Stock Tracker's Contribution Report shows how each investment contributes to your portfolio's return, from single holdings to asset classes.
Pro Stock Tracker
Are you ready to take your investment analysis to the next level, moving beyond simple tracking and into a deeper understanding of your portfolio's performance? After all, knowing your gains and losses is just the starting point. To truly master your investments, you need to uncover the why behind the numbers – the specific factors that are driving those results. This is where Pro Stock Tracker's Contribution Report comes in, offering a powerful tool, also known as performance attribution, to shed light on these crucial insights.
Demystifying the Contribution Report
The Contribution Report is a powerful tool that goes beyond the basics of portfolio tracking. While a Performance Report focuses on the returns of your holdings over a specific period, the Contribution Report dives deeper. It provides a detailed breakdown of how each individual holding or group of holdings contributes to the overall performance of your portfolio. This allows you to see beyond the surface level and understand the specific factors driving your portfolio's growth or decline.
In essence, the Contribution Report answers the crucial question: "What is truly responsible for my portfolio's return?" Is it a few high-performing stocks, or is your success rooted in a well-diversified mix of assets? Are certain sectors or industries outperforming others? Are international holdings influenced by currency fluctuations?
By analyzing the contribution of each holding or group, you can gain valuable insights into your investment strategy's effectiveness. You can see which holdings are adding the most value, which ones are lagging, and how different asset classes or sectors are performing relative to each other.
How contribution analysis empowers decision-making
Pro Stock Tracker's Contribution Report breaks down your portfolio's performance into various components, making this complex analysis accessible to all investors:
- Security selection: This measures the impact of your individual stock picks. Did your choices outperform or underperform the broader market or a specific benchmark?
- Asset allocation: This assesses the influence of your asset mix (stocks, bonds, real estate, etc.). Did your chosen allocation help or hinder your performance compared to alternative strategies?
- Sector and industry allocation: This examines how your exposure to specific sectors (e.g., technology, healthcare) or industries contributed to your overall returns.
- Geographic allocation: This considers the impact of your investments in different countries or markets. Are certain regions outperforming others?
- Currency effects: For international investors, this analyzes how fluctuations in exchange rates impacted your portfolio's value.
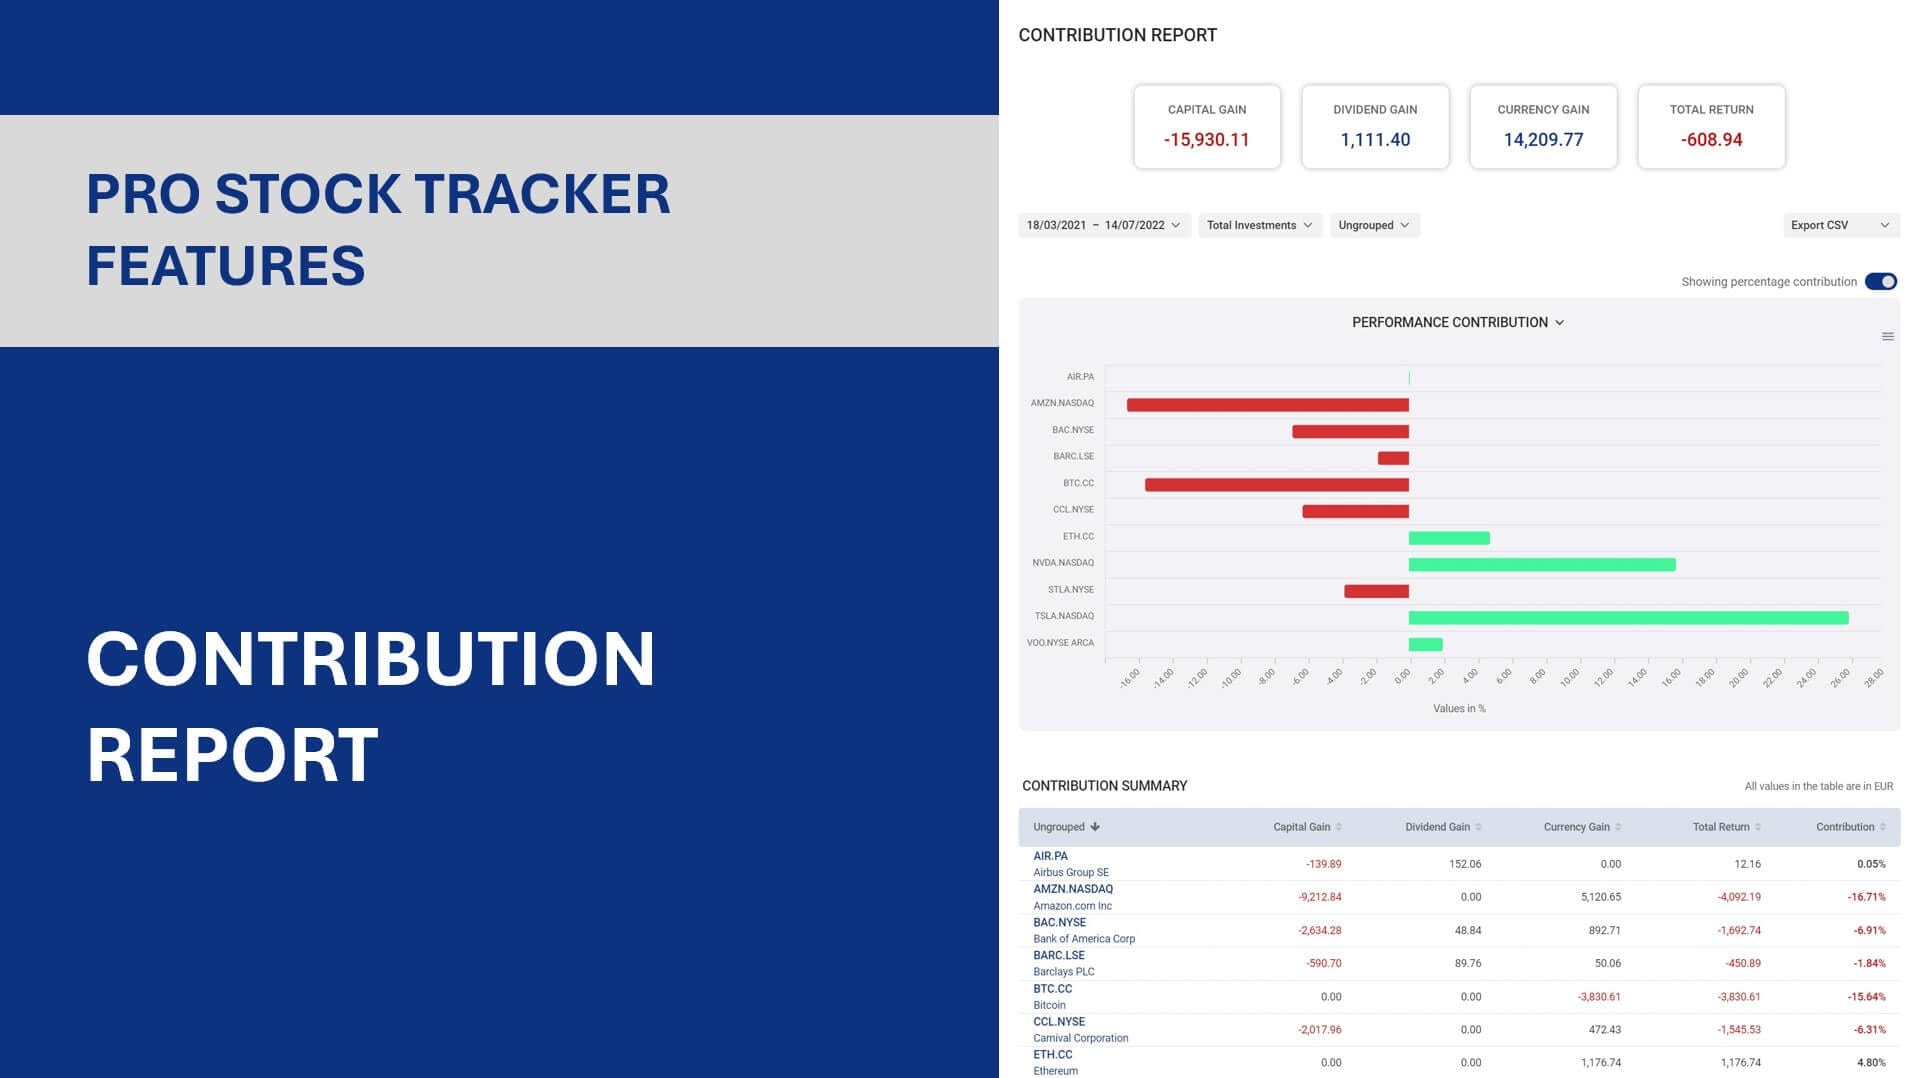
The Contribution Report isn't just about showing percentages; it reveals the actual dollar value that each holding contributes to your portfolio's overall return. This allows you to see not only which holdings are performing well on a percentage basis, but also which ones are having the biggest impact on your bottom line.
This deeper level of insight empowers you to make more informed decisions about your portfolio. You can identify which holdings are truly driving your success, re-evaluate underperforming assets, adjust your asset allocation, spot emerging trends, and benchmark your performance against relevant indices.
Performance vs Contribution Reports in Pro Stock Tracker
Investors often seek detailed insights into their portfolios to make informed decisions. Pro Stock Tracker offers two valuable reports: the Performance Report and the Contribution Report. Both reports provide essential information, but they serve different purposes. Understanding the differences between these reports can help investors choose the right tool for their needs.
Performance Report
The Performance Report is designed to give a quick overview of the total return of a portfolio or individual holdings over a specified period. This report includes total monetary and percentage returns broken down into components such as capital gains, dividends, and currency fluctuations.
For example, if you purchased a stock twelve months ago and it has doubled in value, the Performance Report will show a 100% return under the capital section. This report is particularly useful for a high-level view of how well your investments are performing overall or how a particular asset is doing in isolation.
Contribution Report
The Contribution Report, on the other hand, dives deeper into the portfolio's performance. It examines the specific contribution of each holding and group of holdings to the overall portfolio return, providing a more nuanced analysis. Instead of simply showing individual holding returns, it calculates the actual dollar amount and percentage that each holding contributes to your overall gain or loss.
Consider a scenario where you invested $100,000 in one stock and $10,000 in another, and both stocks have increased by 50%. While the Performance Report would show an overall return of 50%, it doesn’t reflect the true impact each stock has on the portfolio. The Contribution Report will illustrate that the first stock, with a much larger initial investment, has contributed significantly more to the portfolio total return than the second stock.
Key differences
- Purpose: The Performance Report gives a high-level summary of your portfolio's results, while the Contribution Report is a detailed breakdown of the underlying factors driving those results.
- Focus: The Performance Report focuses on individual holdings, groups of holdings, and overall portfolio returns, whereas the Contribution Report emphasizes the individual contributions that holdings or groups of holdings make to the portfolio’s performance.
- Use case: The Performance Report offers a comprehensive view of your portfolio's total return, while the Contribution Report reveals the impact of individual holdings and groups on that performance. Utilize both reports to make informed decisions about buying, selling, or adjusting your investments.
By understanding the difference between these two reports and using them in conjunction, investors can gain an in-depth understanding of their portfolio's performance, enabling them to make informed and strategic investment decisions.
Pro Stock Tracker's Contribution Report
Pro Stock Tracker's Contribution Report is more than just a static report; it's a dynamic tool designed to empower your investment analysis. It provides a user-friendly and comprehensive way to understand the complex forces at play within your portfolio. Here's how:
- Intuitive visualizations: Interactive charts bring your data to life, making it easy to compare the contribution of individual holdings or groups of holdings, and visualize their impact on your portfolio's performance over time.
- Granular insights: The report allows you to drill down into specific details, examining the contribution of individual holdings, asset classes, sectors, industries, markets, currencies or even geographic regions.
- Customizable analysis: Tailor the report to your specific needs by selecting the desired time period, filtering by total investments (including sold shares) or active investments (excluding sold shares), and grouping holdings according to your preferences.
- Actionable data: Export your report data to CSV for further analysis in spreadsheets or other financial tools, enabling you to incorporate these insights into your broader investment strategy.
With its combination of visual clarity, detailed data, and customization options, Pro Stock Tracker's Contribution Report empowers you to take control of your financial future.
Want more information?
Visit our Learn page for more detailed instructions, or start your free trial now to experience the benefits first-hand.
Smarter investing with Pro Stock Tracker
Don't settle for a superficial understanding of your portfolio. Embrace the power of performance attribution with Pro Stock Tracker's Contribution Report. By uncovering the drivers behind your overall returns, you can make more informed decisions, refine your strategy, and ultimately achieve greater success in your investment journey. Ready to see how Pro Stock Tracker's Contribution Report can transform your investment analysis? Try it today and unlock the power of:
- Comprehensive tracking: Seamlessly monitor your stocks, ETFs, forex, cryptocurrencies, bonds, and mutual funds across 86 global exchanges – all in one place.
- 30+ years of historical data: Gain unparalleled insights backed by our robust historical data infrastructure.
- Automated accuracy: Ensure your financial information is always up-to-date with automatic dividend and corporate action synchronization.
- Powerful analytics: Access a suite of advanced tools, from in-depth performance reports to portfolio diversification and comparison analyses.
Don't miss out on the opportunity to make informed, data-driven decisions that can transform your investment journey. Sign up for a free account today and experience the difference Pro Stock Tracker can make for your portfolio.
Disclaimer: The information provided in this article is for general informational purposes only and does not constitute specific advice, including but not limited to financial, investment, or legal advice. While we strive to ensure the accuracy and completeness of the information, we make no guarantees and assume no liability for any actions taken based on the content provided. Please consult with a qualified professional for advice tailored to your individual circumstances.