Trade Report
The Trade Report in Pro Stock Tracker provides a comprehensive record of all your transactions over any timeframe. With flexible filtering options, you can easily customize the report to see only the trades you're interested in. Gain insights into your cash flow, track the evolution of your holdings, and assess the impact of your trading decisions.
Understanding the report
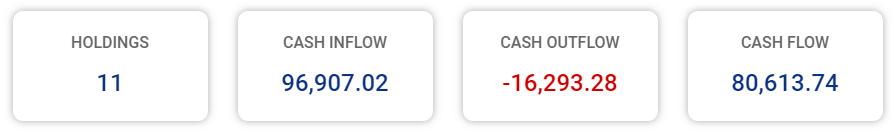
Tabs: Four tabs at the top summarize key aspects of your trading activity:
- Holdings: The total number of holdings involved in the displayed transactions.
- Cash inflow: The total amount of money invested into the portfolio or selected holding during the specified period.
- Cash outflow: The total amount of money withdrawn from the portfolio or selected holding during the specified period.
- Cash flow: The net difference between cash inflow and cash outflow, representing the overall change in cash position due to trading activities.
Options: Customize your report and export data using the available options:
- Period: Choose from preset periods (e.g., last 3 months, last 5 years) or define a custom date range.
- Filter by holding: Select a specific holding from the dropdown menu to focus the report on its transactions only.
- Export: Download the report data as a CSV file for further analysis or record-keeping.
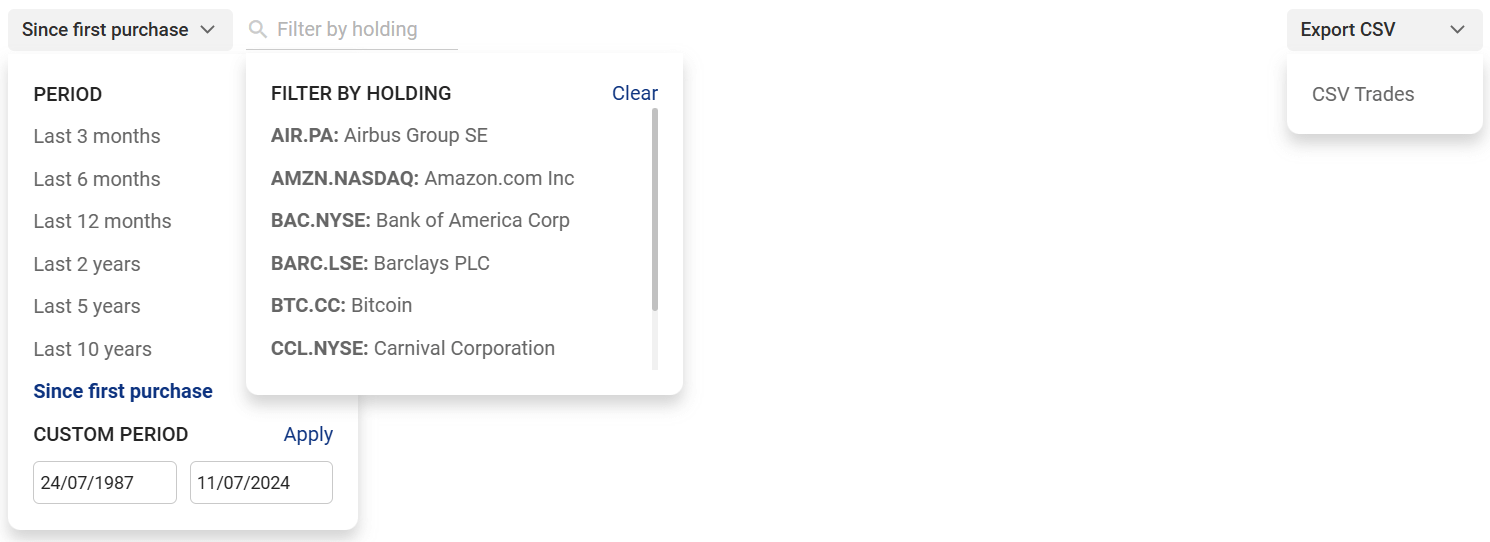
Chart: The interactive chart visualizes your portfolio's cash flow over time. You can choose to view this as:
- Monthly cash flow: Aggregated cash flow per month.
- Quarterly cash flow: Aggregated cash flow per quarter.
- Yearly cash flow: Aggregated cash flow per year.
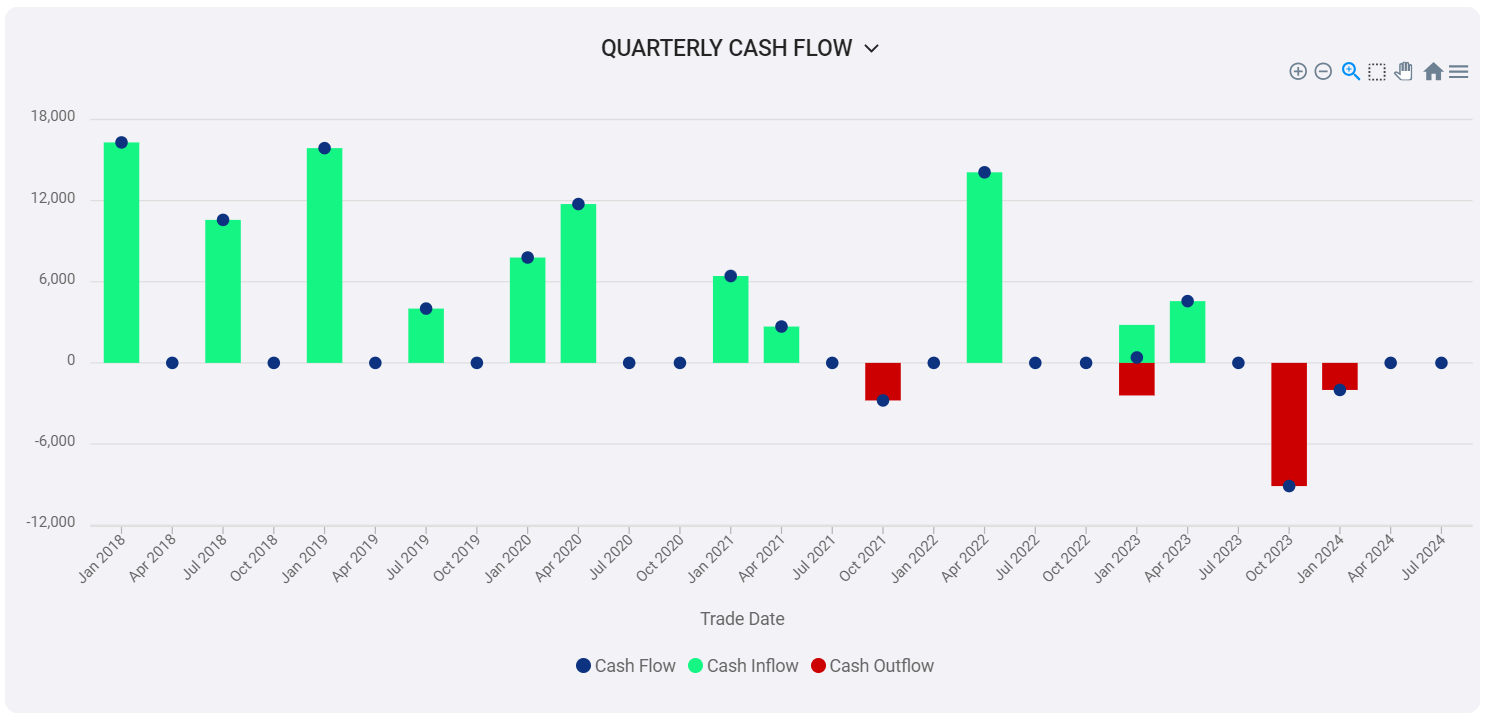
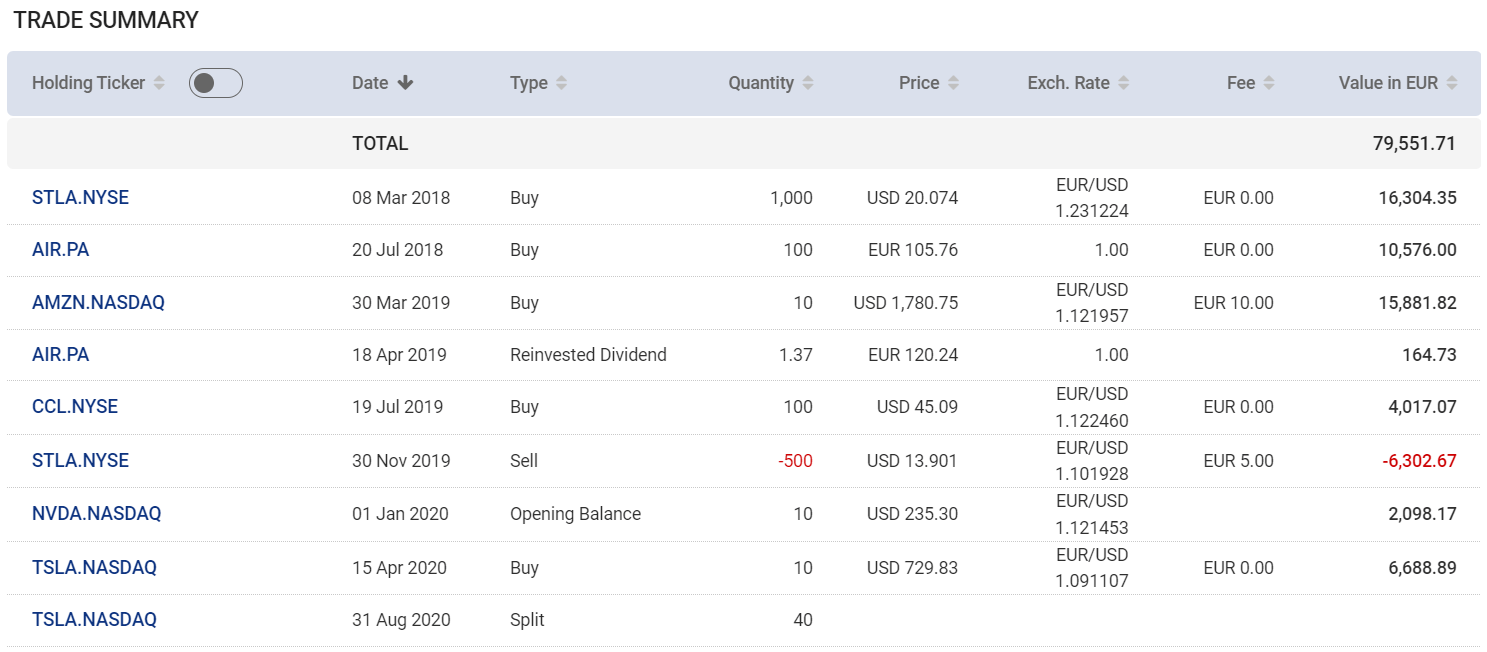
Table: The detailed table displays transactions for the selected portfolio or holding over the specified period:
- Holding: The specific asset involved in each transaction.
- Date: The date of each transaction.
- Type: The type of transaction (buy, sell, split, bonus, reverse split, etc.).
- Quantity, price, exchange rate, fee: Details about each transaction. Note that the price is displayed in the traded currency of the holding, while the fee is displayed in the currency selected by the user.
- Value: The total value of the transaction in your portfolio's currency.
You can sort the table by clicking on any column header. Additionally, clicking on a holding will take you to that holding's individual page for a more in-depth look.
How to use the report
The steps below will give you a quick overview on how to use the report.
- Go to Trade Report.
- Use the filters to select your desired period and filter by holding (optional).
- Review the tabs at the top for a summary of holdings, cash inflow, cash outflow, and net cash flow.
- View the chart to visualize your cash flow over time.
- Analyse the table to see details for each transaction.
- (Optional) Click the Export button to download the report data as a CSV file.
Note: The data in the report is always relative to the period and filters you select.