Performance Report
The Performance Report in Pro Stock Tracker offers a comprehensive analysis of your portfolio's performance over any time frame. With flexible filtering options, including period, total vs active investments, grouping, and analysis type (monetary or percentage gains), you can easily tailor the report to your specific needs. Gain a granular understanding of your returns, with the total return broken down into capital gains, dividend gains, and currency gains.
Understanding the report
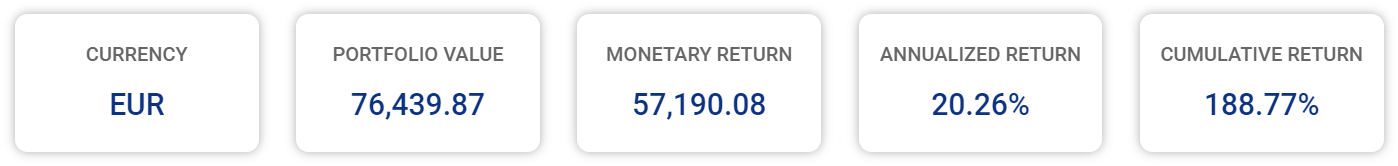
Tabs: Five tabs at the top summarize key aspects of your performance:
- Currency: The currency your portfolio is denominated in (e.g., USD).
- Portfolio value: The total value of your portfolio at the end of the selected period.
- Monetary return: Your total monetary gains or losses over the selected period.
- Annualized return: Your compounded annualized return percentage over the selected period.
- Cumulative return: Your total return percentage over the selected period.
Options: Customize your report and export data using the available options:
- Period: Choose from pre-set periods (e.g., last 7 days, last year) or define a custom date range.
- Positions: Select "Total Investments" to see the performance of all shares held in the portfolio during the selected period (including sold shares), or "Active Investments" to see the performance of only those shares held at the end date (excluding sold shares).
- Grouped by: Organize your holdings by market, country, currency, sector, industry, asset class, or "Ungrouped" for a single list.
- Show: Choose how you want to view the percentage gains for your returns. Select "Annualized Return" to see the compounded annualized percentage, or "Cumulative Return" to see the total percentage over the period. Note that this selection does not affect monetary gain figures.
- Display: Toggle between viewing monetary gains or percentage gains for your returns.
- Export: Download the report data as a CSV file.
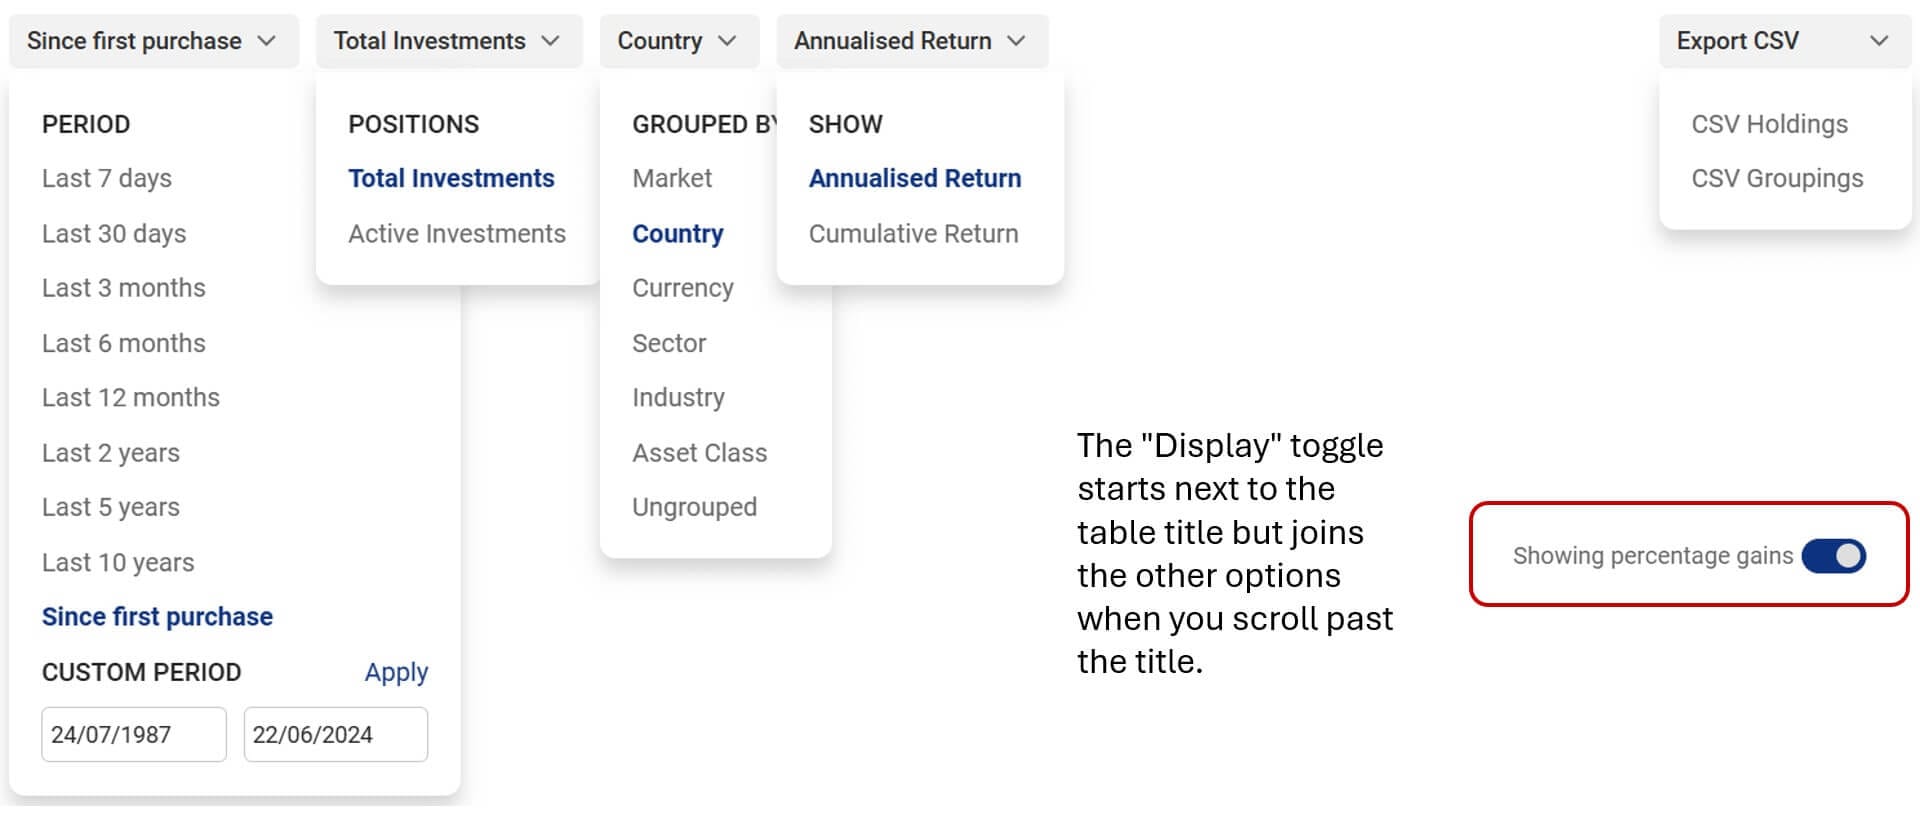
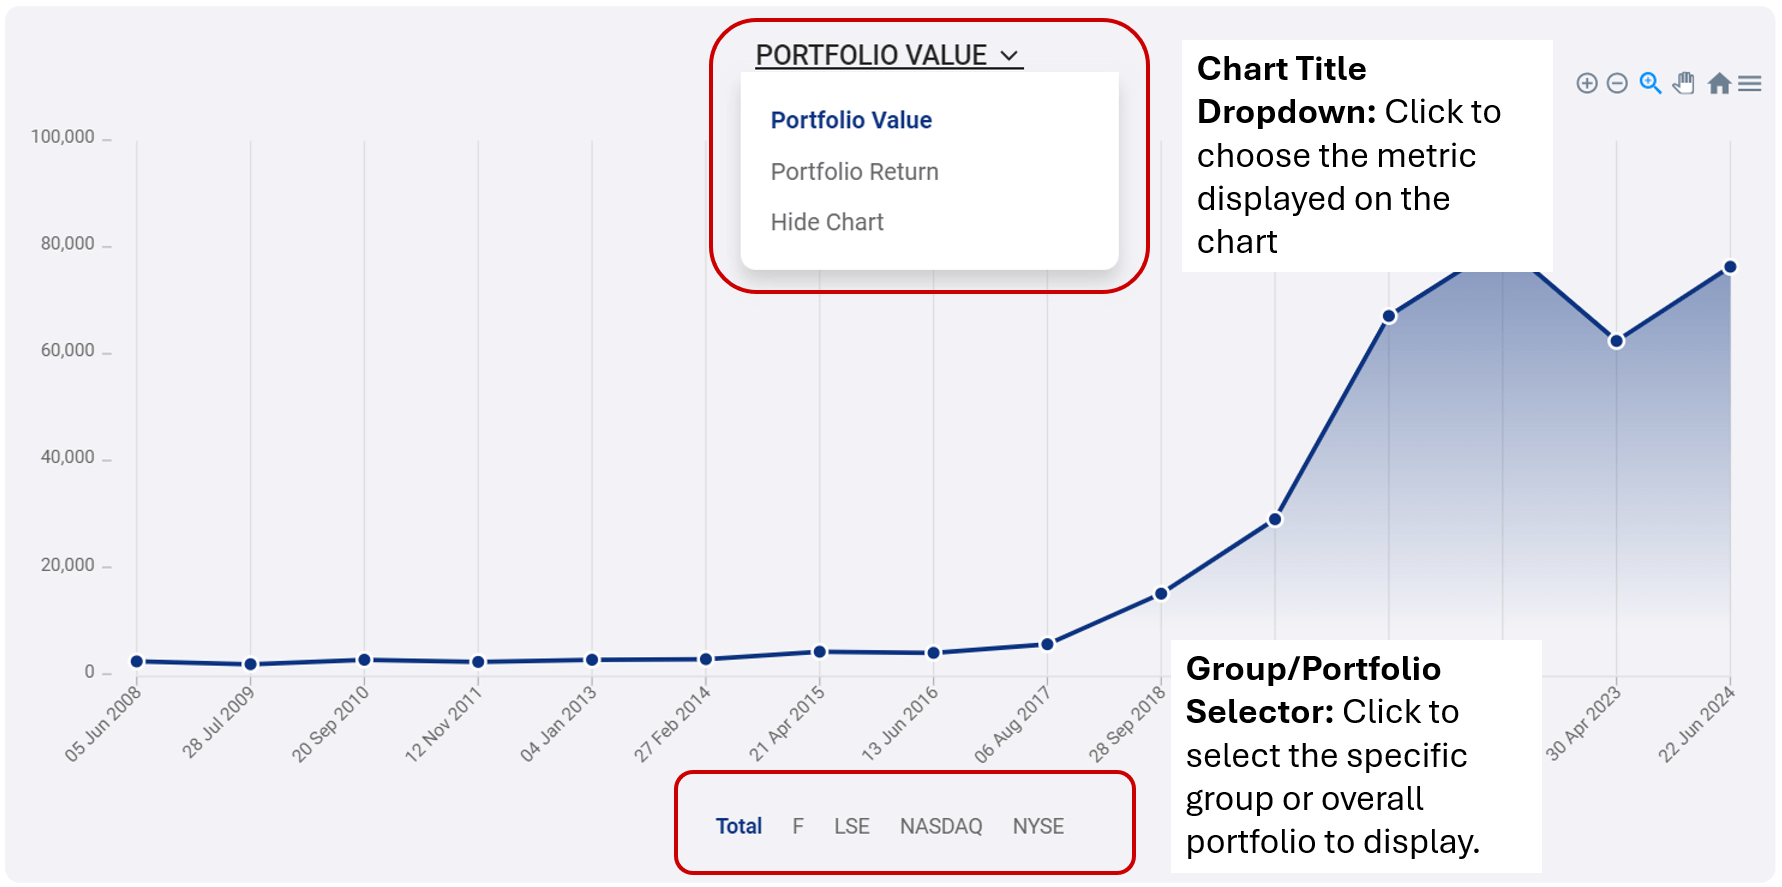
Chart: The interactive chart visualizes your portfolio's value or return over time. You can toggle between viewing the:
- Total portfolio's value or return.
- Value or return of specific groups.
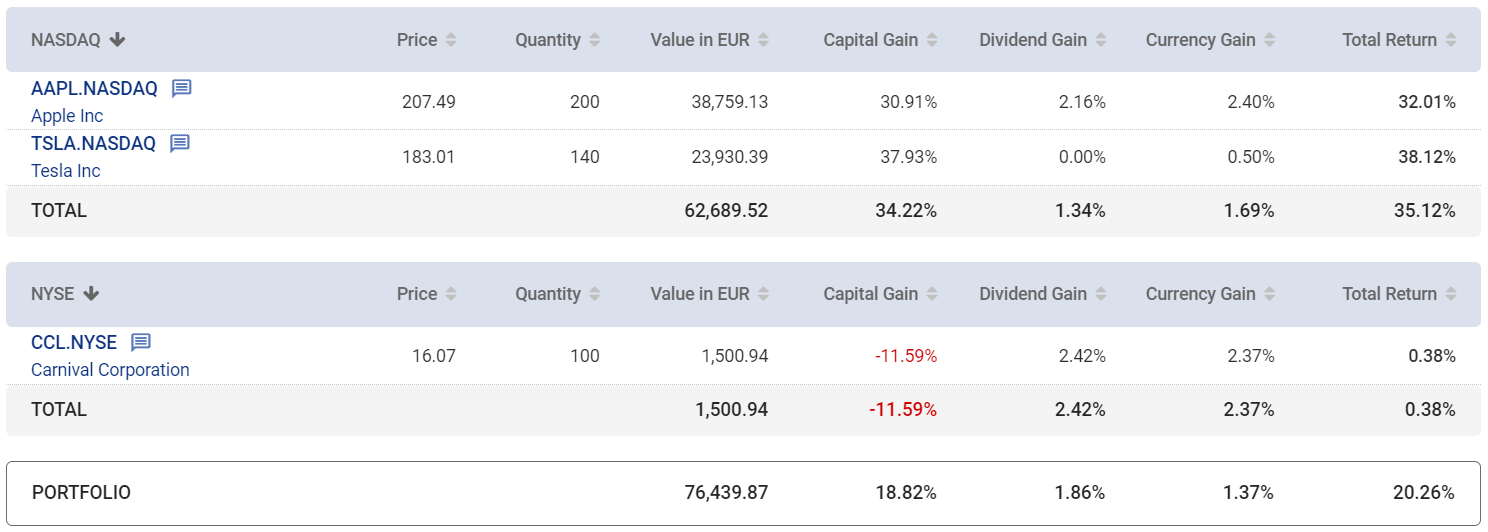
Portfolio Performance Overview: This section provides a detailed breakdown of your portfolio's total return, divided into capital gains, dividend gains, currency gains, and the overall total return. You can view the performance in both monetary and percentage terms.

Table: The detailed table displays:
- Individual groups and holdings present in the selected period, determined by your choice of "Total Investments" or "Active Investments".
- Each holding's price, quantity, and value in your portfolio's currency as of the end date.
- Capital gains, dividend gains, currency gains, and total return for each group and holding, calculated over the selected period.
- A message icon may appear next to some holding names, indicating new, automatic corporate actions (such as dividends, splits, or reverse splits) that require your attention. Hover over the icon to see the number of unconfirmed transactions. Clicking on the holding name will take you to that holding's individual page, where you can review and confirm these actions.
You can sort the table by clicking on any column header. You can also click on any holding name to view its individual page and see the holding's complete transaction history.
How to use the report
The steps below will give you a quick overview on how to use the report.
- Go to Performance Report.
- Use the filters to select your desired period, positions, grouping, and analysis type.
- View the chart to visualize your portfolio's value or return, either in total or for specific groups.
- View the performance overview section for a detailed breakdown of your portfolio's return.
- Analyse the table to see details for each holding and group.
- (Optional) Click the Export button to download the report data as a CSV file.
Note: The return figures are always relative to the period you select. The price, quantity, and value data represent the status as of the end date of the chosen period.