Dividend Report
The Dividend Report in Pro Stock Tracker provides a detailed overview of your dividend income over any timeframe. With flexible filtering options, you can easily customize the report to focus on specific holdings or periods. Gain insights into your dividend income streams, track the growth of your payouts, and assess the contribution of dividends to your overall portfolio performance.
Understanding the report
Tabs: Four tabs at the top summarize key aspects of your dividend income history:
- Holdings: The total number of holdings that paid dividends in the selected period.
- Gross: The total gross dividend income received in the portfolio or selected holding during the specified period.
- Tax: The total withholding tax deducted from your dividends in the portfolio or selected holding during the specified period.
- Net: The total net dividend income received in the portfolio or selected holding after tax deductions, during the specified period.

Options: Customize your report and export data using the available options:
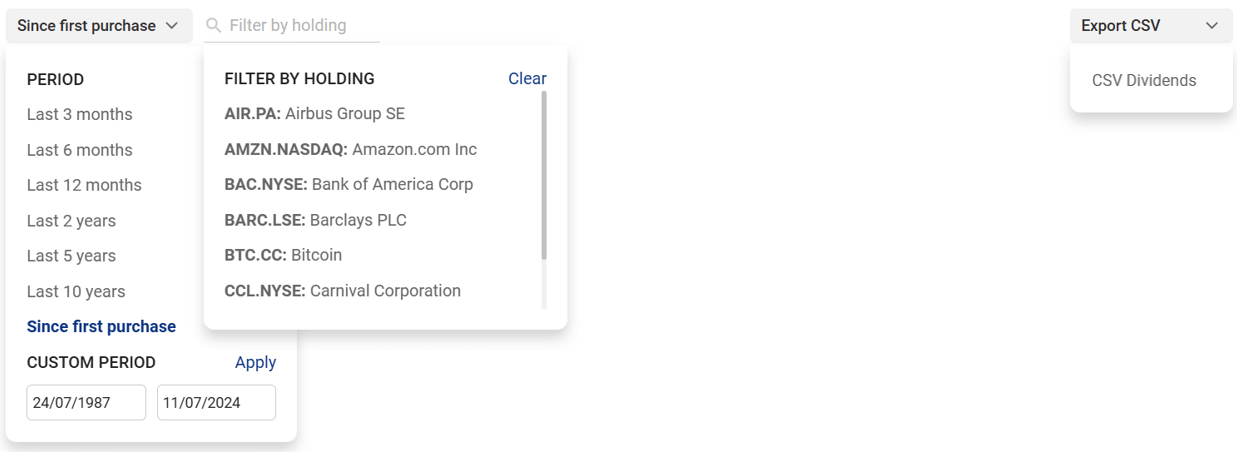
- Period: Choose from preset periods (e.g., last 3 months, last 5 years) or define a custom date range.
- Filter by holding: Select a specific holding from the dropdown menu to focus the report on its dividend payments only.
- Export: Download the report data as a CSV file for further analysis or record-keeping.

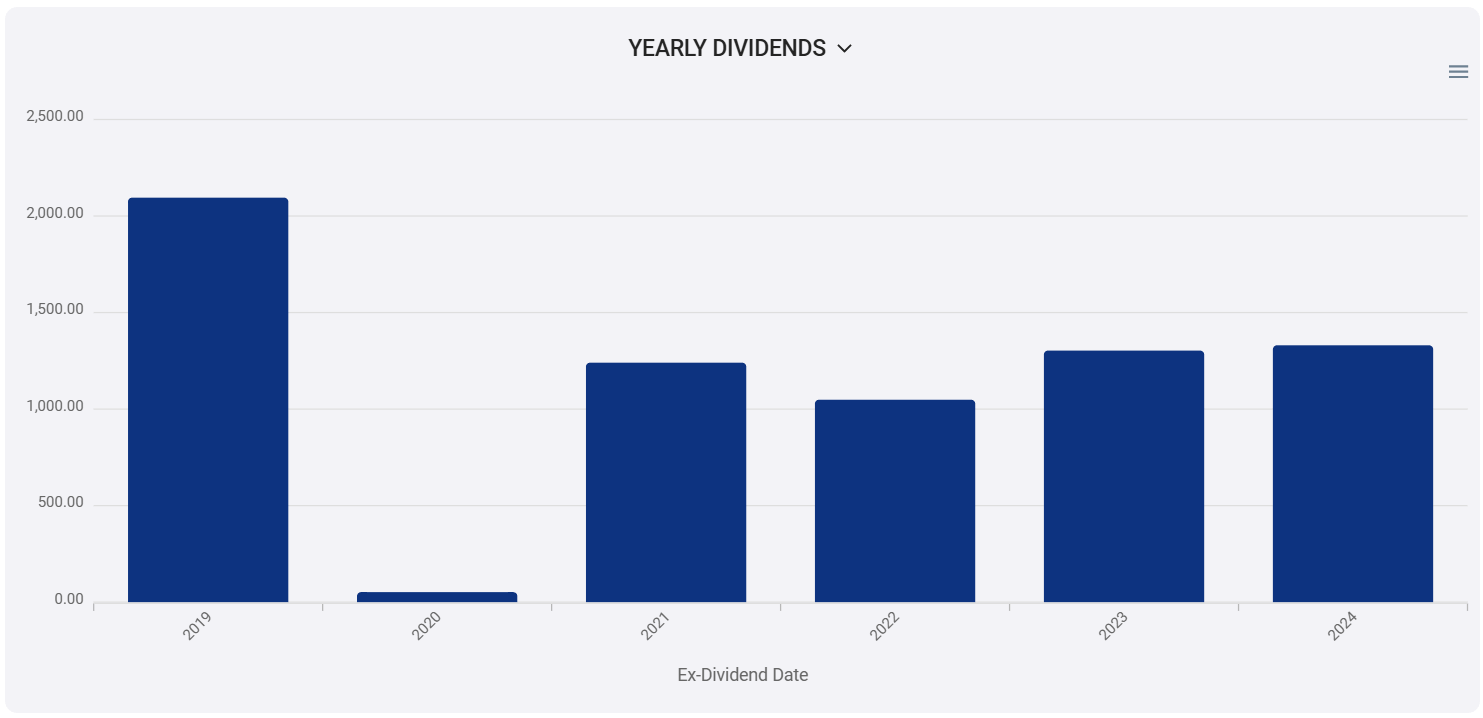
Chart: The interactive chart visualizes your portfolio's or selected holding's gross dividend income over time. You can choose to view this as:
- Quarterly cash flow: Aggregated dividend income per quarter.
- Yearly cash flow: Aggregated dividend income per year.

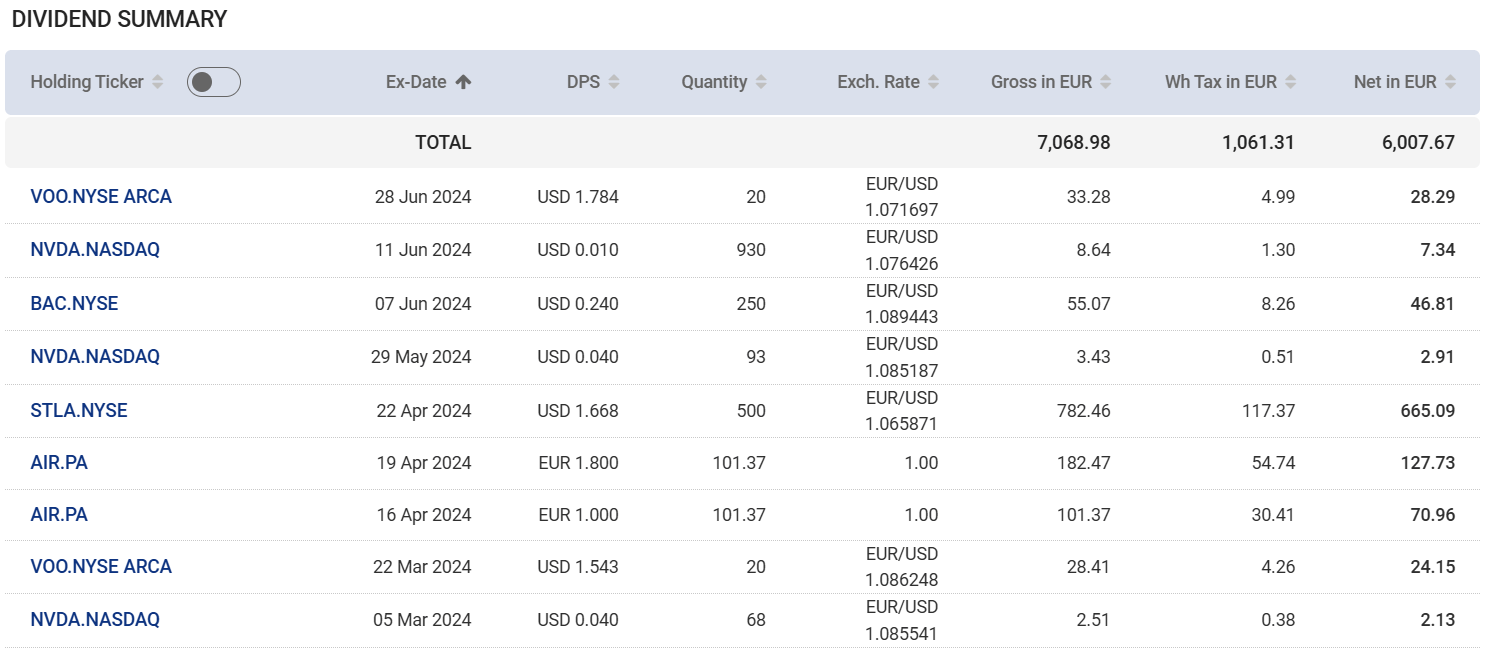
Table: The detailed table displays individual dividend payments for the selected portfolio or holding over the specified period:
- Holding: The specific asset that paid the dividend.
- Ex-date: The ex-dividend date, which is the date before which you must own the stock to be eligible for the dividend. An "R" next to the date indicates that the dividend was reinvested.
- DPS: Dividend Per Share, the amount of the dividend per share held.
- Quantity: The number of shares you owned the day before the ex-dividend date, which determines the amount of the dividend you receive.
- Exchange rate: The exchange rate used to convert foreign dividends into your portfolio's currency.
- Gross, tax, net: The gross dividend amount, withholding tax, and net dividend amount, all in your portfolio's base currency.
You can sort the table by clicking on any column header. Additionally, clicking on a holding will take you to that holding's individual page for a more in-depth look.

How to use the report
The steps below will give you a quick overview on how to use the report.
- Go to Dividend Report.
- Use the filters to select your desired period and filter by holding (optional).
- Review the tabs at the top for a summary of holdings, gross dividends, tax withheld, and net dividends.
- View the chart to visualize your dividend income over time.
- Analyze the table to see details for each dividend payment.
- (Optional) Click the Export button to download the report data as a CSV file.
Note: The data in the report is always relative to the period and filters you select.

