Diversity Report
The Diversity Report in Pro Stock Tracker provides a comprehensive overview of your portfolio's diversification across various dimensions at a specific point in time. With flexible filtering options, including date and grouping, you can easily tailor the report to your specific needs. Gain a clear understanding of how your investments are spread across different markets, countries, currencies, sectors, industries, and asset classes.
Understanding the report
Tabs: Six tabs at the top summarize the number of unique entries within each category on the selected date:
- Markets: The number of markets your portfolio is invested in.
- Countries: The number of countries your portfolio is invested in.
- Currencies: The number of currencies your portfolio is invested in.
- Sectors: The number of sectors your portfolio is invested in.
- Industries: The number of industries your portfolio is invested in.
- Asset classes: The number of asset classes your portfolio is invested in.

Options: Customize your report and export data using the available options:
- Date: Choose the specific date for which you want to view the diversity report.
- Grouped by: Organize your holdings by market, country, currency, sector, industry, asset class, or "Ungrouped" for a single list.
- Export: Download the report data as a CSV file.
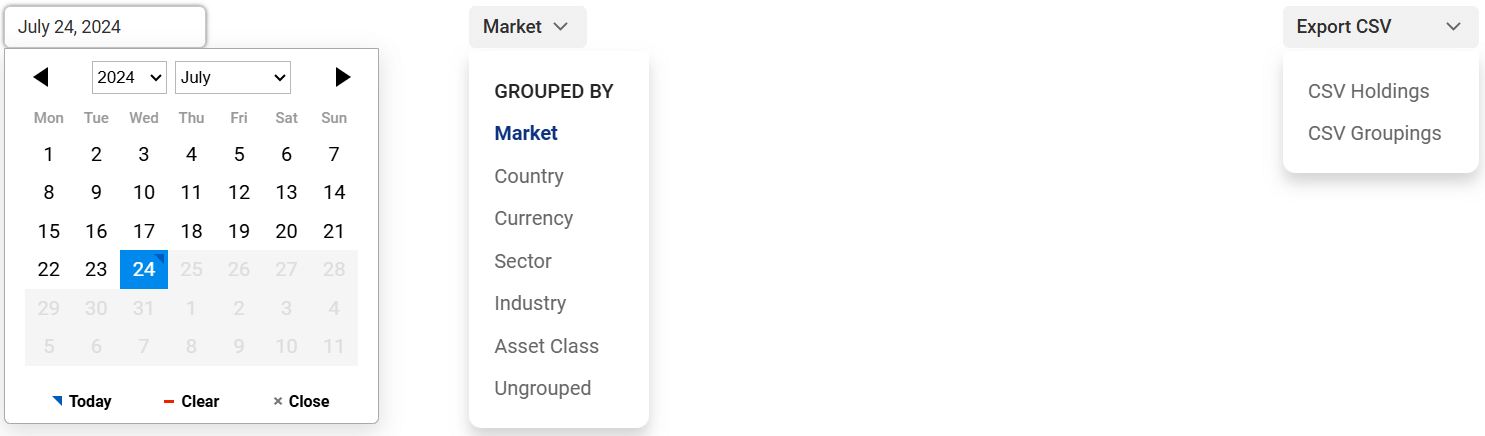
Chart: The interactive pie chart visualizes your portfolio's composition based on the selected grouping (or the full list of holdings if "Ungrouped" is selected) as of the chosen date. You can toggle between two views:
- Monetary contributions: Displays the monetary value of each holding or group in your portfolio's base currency.
- Percentage contribution: Displays the percentage contribution of each holding or group to your total portfolio value.
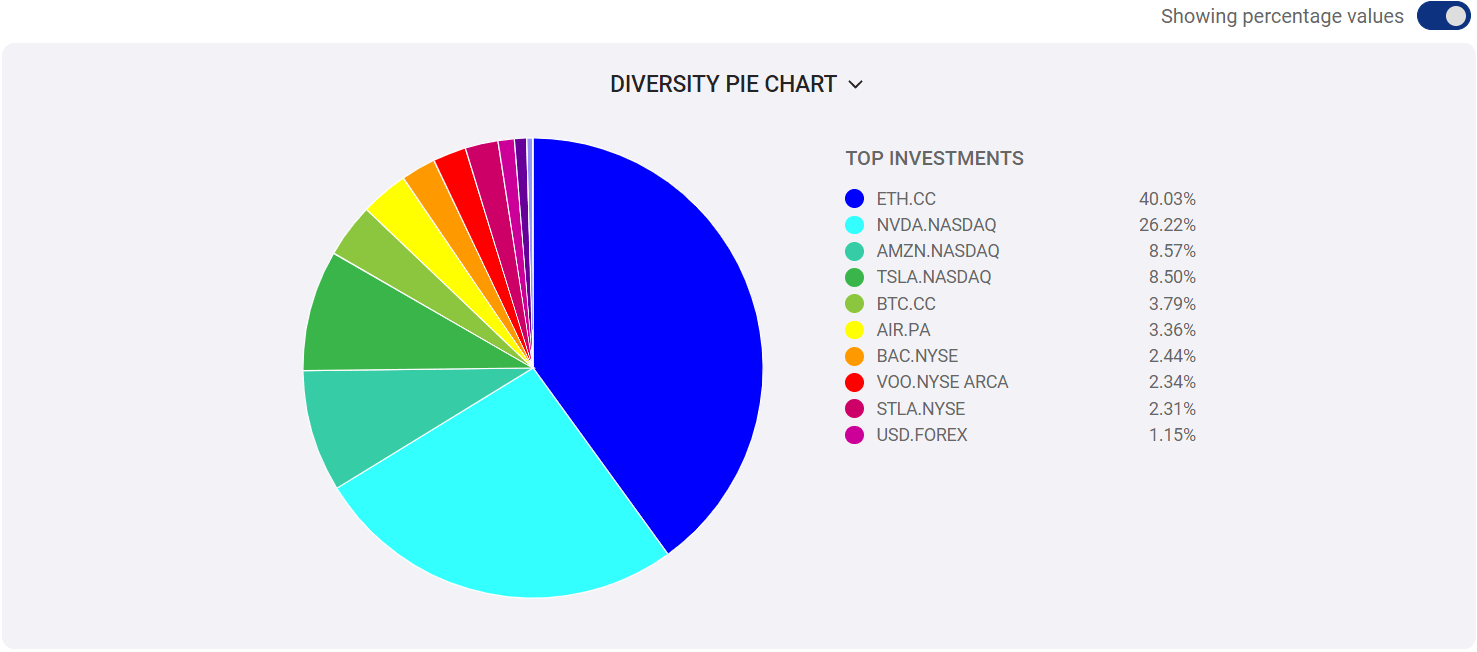
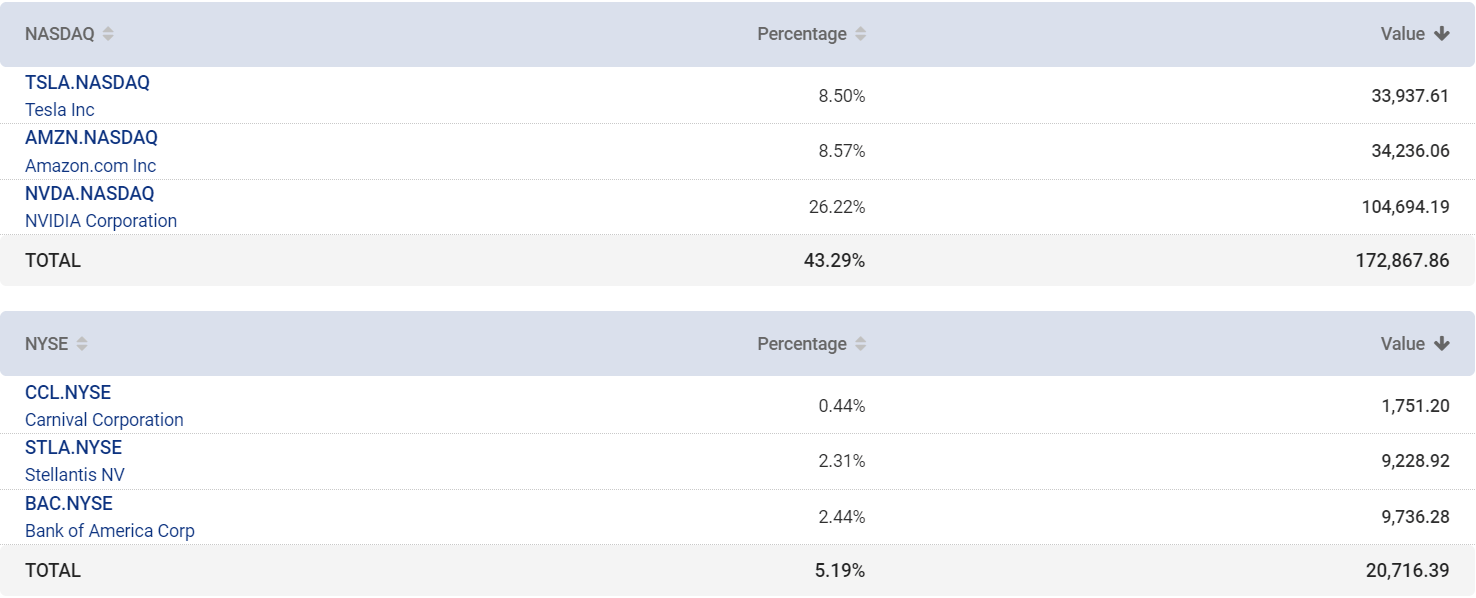
Table: The detailed table displays:
- Individual groups or holdings: All groups or holdings present in your portfolio on the selected date.
- Percentage weight: The percentage each holding or group contributes to your total portfolio value.
- Value: The monetary value of each holding or group in your portfolio's base currency.
You can sort the table by clicking on any column header. You can also click on any holding name to view its individual page and see the holding's complete transaction history.
How to use the report
The steps below will give you a quick overview on how to use the report.
- Go to Diversity Report.
- Use the Date filter to select the desired date.
- Choose the Grouped by option to organize your holdings as desired.
- Review the tabs at the top to get a quick overview of how many unique markets, countries, currencies, sectors, industries, and asset classes your portfolio is invested in.
- View the chart to visualize your portfolio's diversification.
- Analyze the table to see the detailed breakdown of your holdings by group or individual holdings, along with their percentage weight and value.
- (Optional) Click the Export button to download the report data as a CSV file.
Note: The data in the report is specific to the date you select.
We hope this comprehensive guide helps you utilize the Diversity Report effectively to gain valuable insights into your portfolio's diversification and make informed investment decisions.