Benchmarking Report
The Benchmarking Report in Pro Stock Tracker offers a powerful tool to evaluate your portfolio or individual holding's performance relative to a chosen benchmark. By comparing your returns against a specific stock, index, ETF, currency, cryptocurrency, mutual fund, or bond, you gain valuable insights into how your investment strategy is performing.
Understanding the report
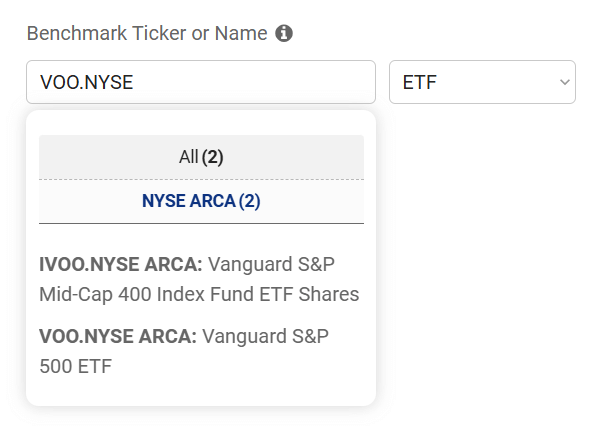
Benchmarking Input: This section allows you to select the specific benchmark which you want to compare your portfolio's performance:
- Select benchmark: Begin by entering the name or ticker symbol of the holding you want to benchmark against. You can choose from various asset classes, including stocks, ETFs, indices, currencies, cryptocurrencies, mutual funds, and bonds.
- Pro Tip: For common security names, refine your search by selecting the asset category and market to quickly find your desired benchmark.
Options: Customize your report and export data using the available options:
- Period: Define the timeframe for your comparison. Choose from preset periods or set a custom date range.
- Filter by holding: Select a specific holding from your portfolio to benchmark it individually against the chosen asset. Note that this filter affects the table data but not the chart.
- Export: Download the report as a CSV file for further analysis or record-keeping.
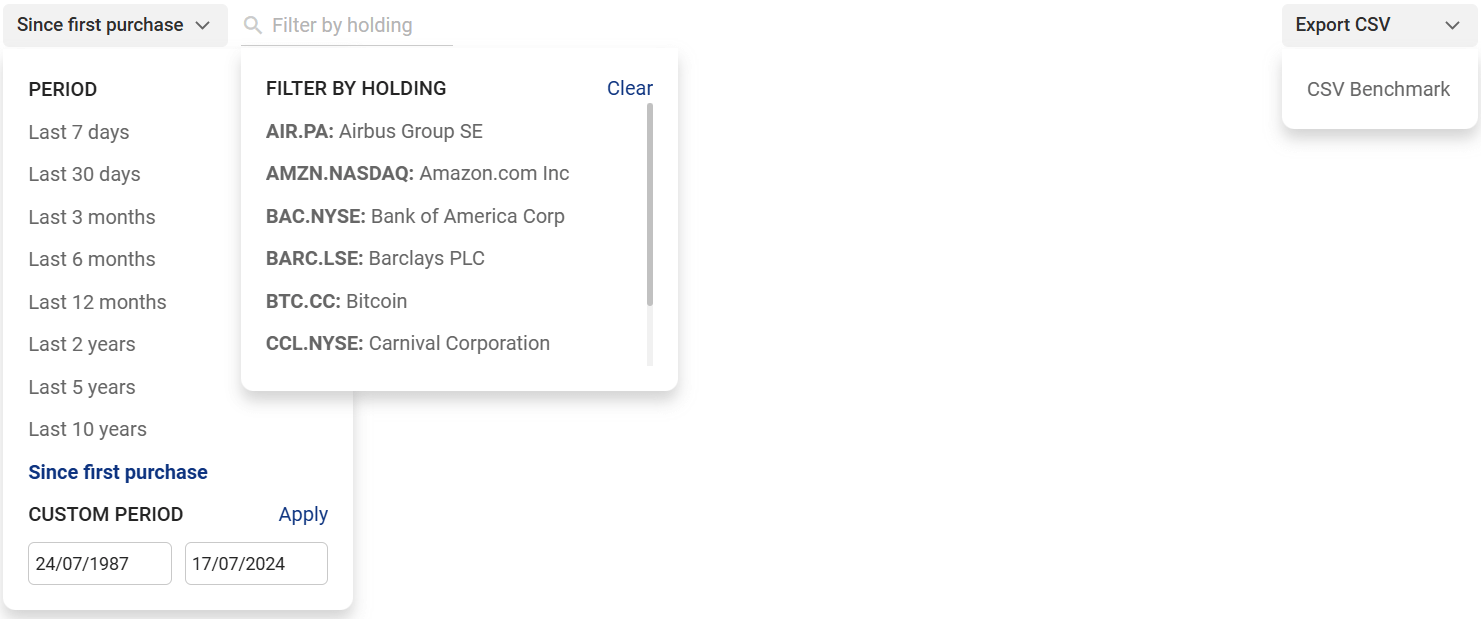
Chart: The interactive chart visually depicts the cumulative total return percentage of your portfolio (in blue) versus the benchmark (in red) over the selected period. The yellow alpha line illustrates the difference between your portfolio return and the benchmark return at each point in time, highlighting whether you're outperforming or underperforming the benchmark. You can toggle the visibility of the portfolio, benchmark, and alpha lines by clicking on their labels in the chart legend.
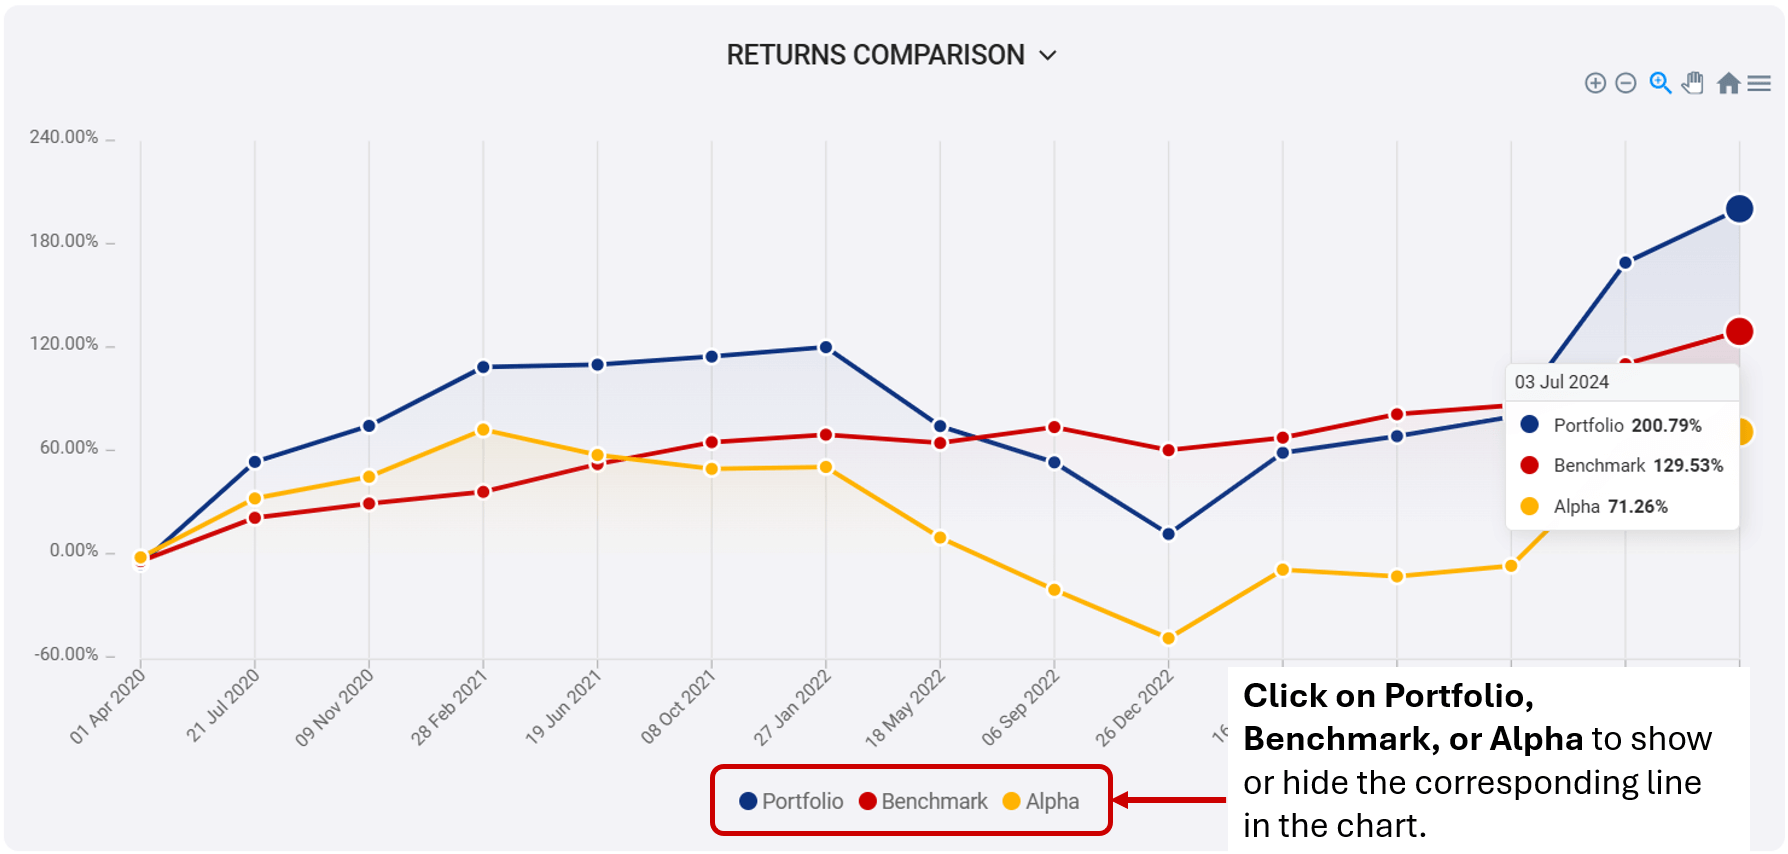
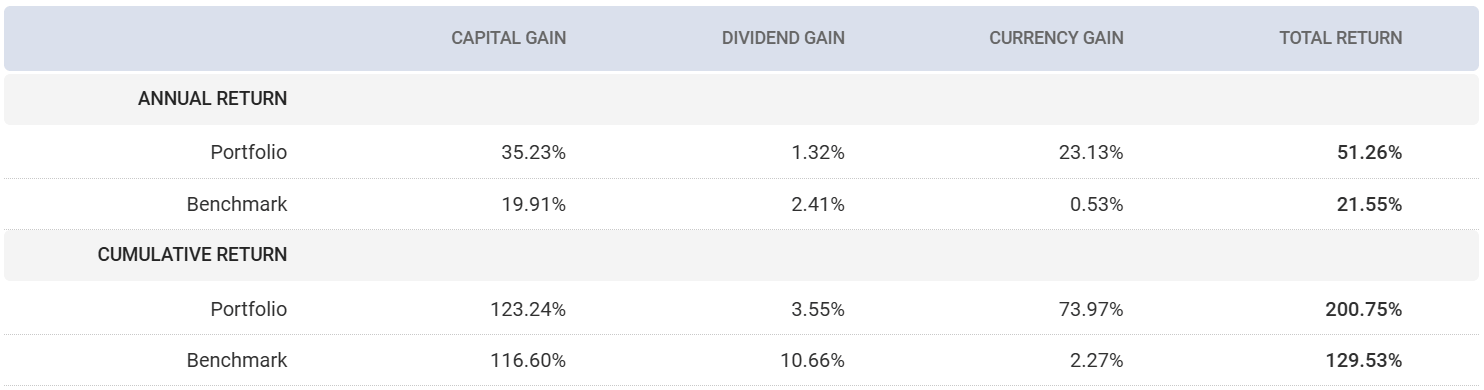
Table: The table provides a detailed comparison of annual and cumulative returns for both your portfolio and the benchmark. If a specific holding is selected, the table will display returns for that holding instead of the entire portfolio. Returns are broken down into capital gain, dividend gain, currency gain, and total return (all in percentage terms).
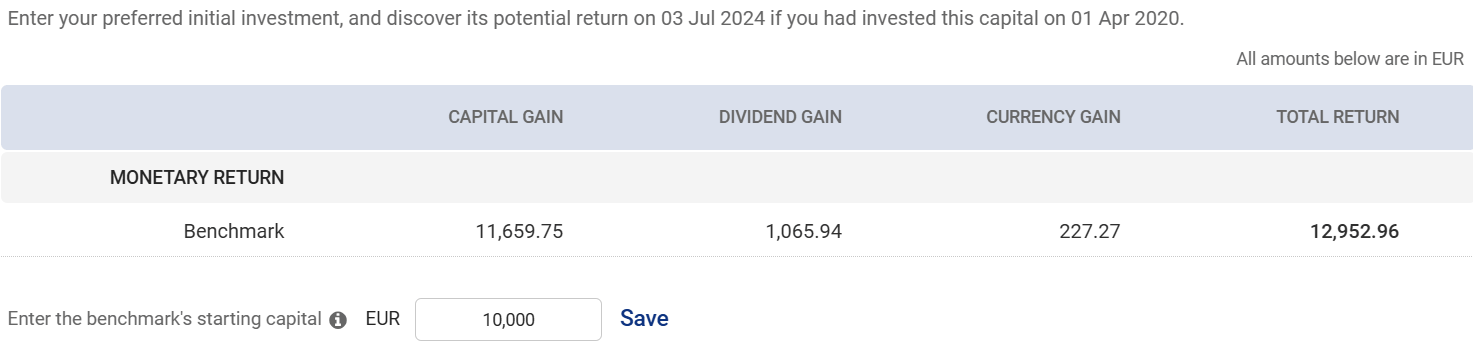
Benchmark Profit Calculator: The Benchmark Profit Calculator estimates the monetary return of the benchmark if you had invested a specific amount at the start of the selected period and held it until the end. You can customize the initial capital amount to explore different investment scenarios. By default, the calculator uses 10,000 units of your portfolio's base currency as the initial investment. It then breaks down this hypothetical return into capital gain, dividend gain, currency gain, and total return, providing a comprehensive view of potential profits.
How to use the report
The steps below will give you a quick overview on how to use the report.
- Go to Benchmarking Report.
- Select your desired benchmark in the input field.
- Use the filters to customize the period and filter by holding (optional).
- Analyze the chart to visualize the performance comparison over time.
- Examine the table for a detailed breakdown of annual and cumulative returns.
- Utilize the Benchmark Profit Calculator to explore potential returns with different investment amounts.
- (Optional) Click Export to download the report data as a CSV file.
Note: The data in the report is always relative to the period and filters you select.